
Garry Golden
More posts from Garry Golden
Imagine a future where individuals can illustrate their progression of lifelong learning and training and its links to their real-world performance. In this version of the future, the once-ubiquitous résumé has been ousted by the experience graph.
The graph itself will grow out of ExperienceAPI (xAPI), a data specification that allows us to capture and record all types of learning and performance experiences inside the workplace and beyond. Simply put, the software specification enables people to capture enriching “I did X” activity statements — from connecting with Twitter influencers to earning certifications — and present them as an experience graph.
By connecting data points in an experience graph, a more complete narrative emerges about the ways we learn and build skills over time, and how this growth leads to real-world outcomes. And the shift from a résumé’s chronological work history toward real-world experience statements will most likely be steered by a platform like LinkedIn.
Rise of social and professional graphs
Unlike table databases that store information in rows and columns, graph databases store information as entities (or nodes) and the relationships that link them. Graph thinking is an approach to organizing information and trying to understand the world in terms of relationships between things.
When LinkedIn was created in 2002, graph thinking was still in its infancy. But early social networks like Friendster, MySpace and Facebook popularized the idea of a social graph (who we know; how we know them) and friend-of-a-friend (FOAF) connections. Today, these social graphs are the primary engagement platform for ads, news, entertainment, activism and politics.
The social graph helps us create and sustain personal and community connections. The social graphs we manage via Facebook or Twitter help individuals find people and communities, regardless of their geographic home, that connect online and share our passions for life interests.
The downside of a social graph world has been the emergence of online narrow casting, whereby algorithms (or our own selection biases) limit our exposure to opinions that differ from our preferred worldviews. Despite its drawbacks, the social graph is arguably the most valuable digital asset in the modern age.
LinkedIn’s brand was built on constructing our professional graphs, which enable us to leverage our friends’ and colleagues’ relationships in order to connect with people who could advance our careers. The company’s data-driven culture is steeped in graph thinking, indicated by acquisitions that are helping it explore linked data.
SlideShare, for example, was acquired in 2012 to integrate professional content and understand the sharing dynamics of the most insightful slide decks and white papers posted on the site. In 2015, LinkedIn acquired Lynda.com, a widely used e-training site for people and organizations in search of upskilling.
Today, the company is evolving services based on the economic graph, which shows business and civic leaders the connections of people, skill sets and organizations driving their local economy. City leaders can tap the analytical power of LinkedIn’s economic graph to understand who relocated to their community, their skill sets, how they found work and with which employers.
For businesses seeking to relocate to a specific city, the economic graph can also provide details on untapped skills among city residents. It’s a powerful tool based on macro-level, connected data, but it is not the likely end game for the LinkedIn, brand even under Microsoft’s umbrella.
LinkedIn’s leadership has communicated its vision to understand every job position in the global economy, identify skills needed and the gaps that exist, then help deliver training to empower people for employment.
Beyond the professional graph and economic graph, the tool with the most potential power is one that enables individuals to actively drive their own workplace learning and career growth through the experience graph.
Introducing xAPI and the vision of an experience graph
The vision of an experience graph is a platform that reveals connections between our lifelong learning and formal training with the actual work and skills we demonstrate in the real world. Just as our professional graph shows who we know and how we know them, the experience graph would reveal skills we possess and our learning path for acquiring them.
If this conjures up those annoying skill endorsements that LinkedIn is ever-prompting us to click, fear not. The skills endorsement feature was introduced in 2012 as a first step to painting a rough picture of our real-world skills. But instead of pressuring our colleagues for endorsements, the data inputs of the future will be less subjective and based on our real-world experiences, performance and outcomes. To understand the potential for an experience graph to capture these real-world elements, let’s explore ExperienceAPI (xAPI).
The formal specification xAPI was designed for initial use in Learning & Development (L&D) settings to capture “I did X” statements. In the most basic terms, it translates to Person + Action + Object (e.g. Howard [Person] attended a webinar [Action] on Design Thinking [Object]).
Today’s early adopter L&D teams are layering xAPI into training applications, and in the near future, we can imagine “I did X” statements integrated into our most common social and enterprise tools. Most likely, activity statements will be captured passively or require one-click approval from the user before xAPI statements are added to the experience graph.
A working group of xAPI developers is building out a detailed library of verbs that will define what activity statements can be captured. The vocabulary range will likely include micro-experiences such as “logged in” a course, “liked” a post or “paused” a video — as well as milestone experiences such as “joined” a group or “completed” a course.
In this illustration, we focus on milestone activity statement captures of an individual’s hypothetical journey from discovering a new concept, to learning and acquiring skills, to demonstrating proficiency and ultimately landing a position in that field:
- Lucy read a TechCrunch article on the blockchain development platform Ethereum
- Lucy created an Ethereum Blockchain folder in Evernote
- Lucy followed @ethereumproject on Twitter
- Lucy followed @ethereumjoseph (CEO of Consensys Inc.)
- Lucy joined a NYC Meetup group of Ethereum blockchain developers
- Lucy listened to Ethercast episode No. 13 on SoundCloud
- Lucy took a Udacity MOOC on cryptography
- Lucy earned a certification in blockchain database from Lynda.com
- Lucy attended a blockchain conference in NYC
- Lucy uploaded a forked blockchain application on GitHub
- Lucy was hired by Consensys Inc. to build decentralized applications on Ethereum
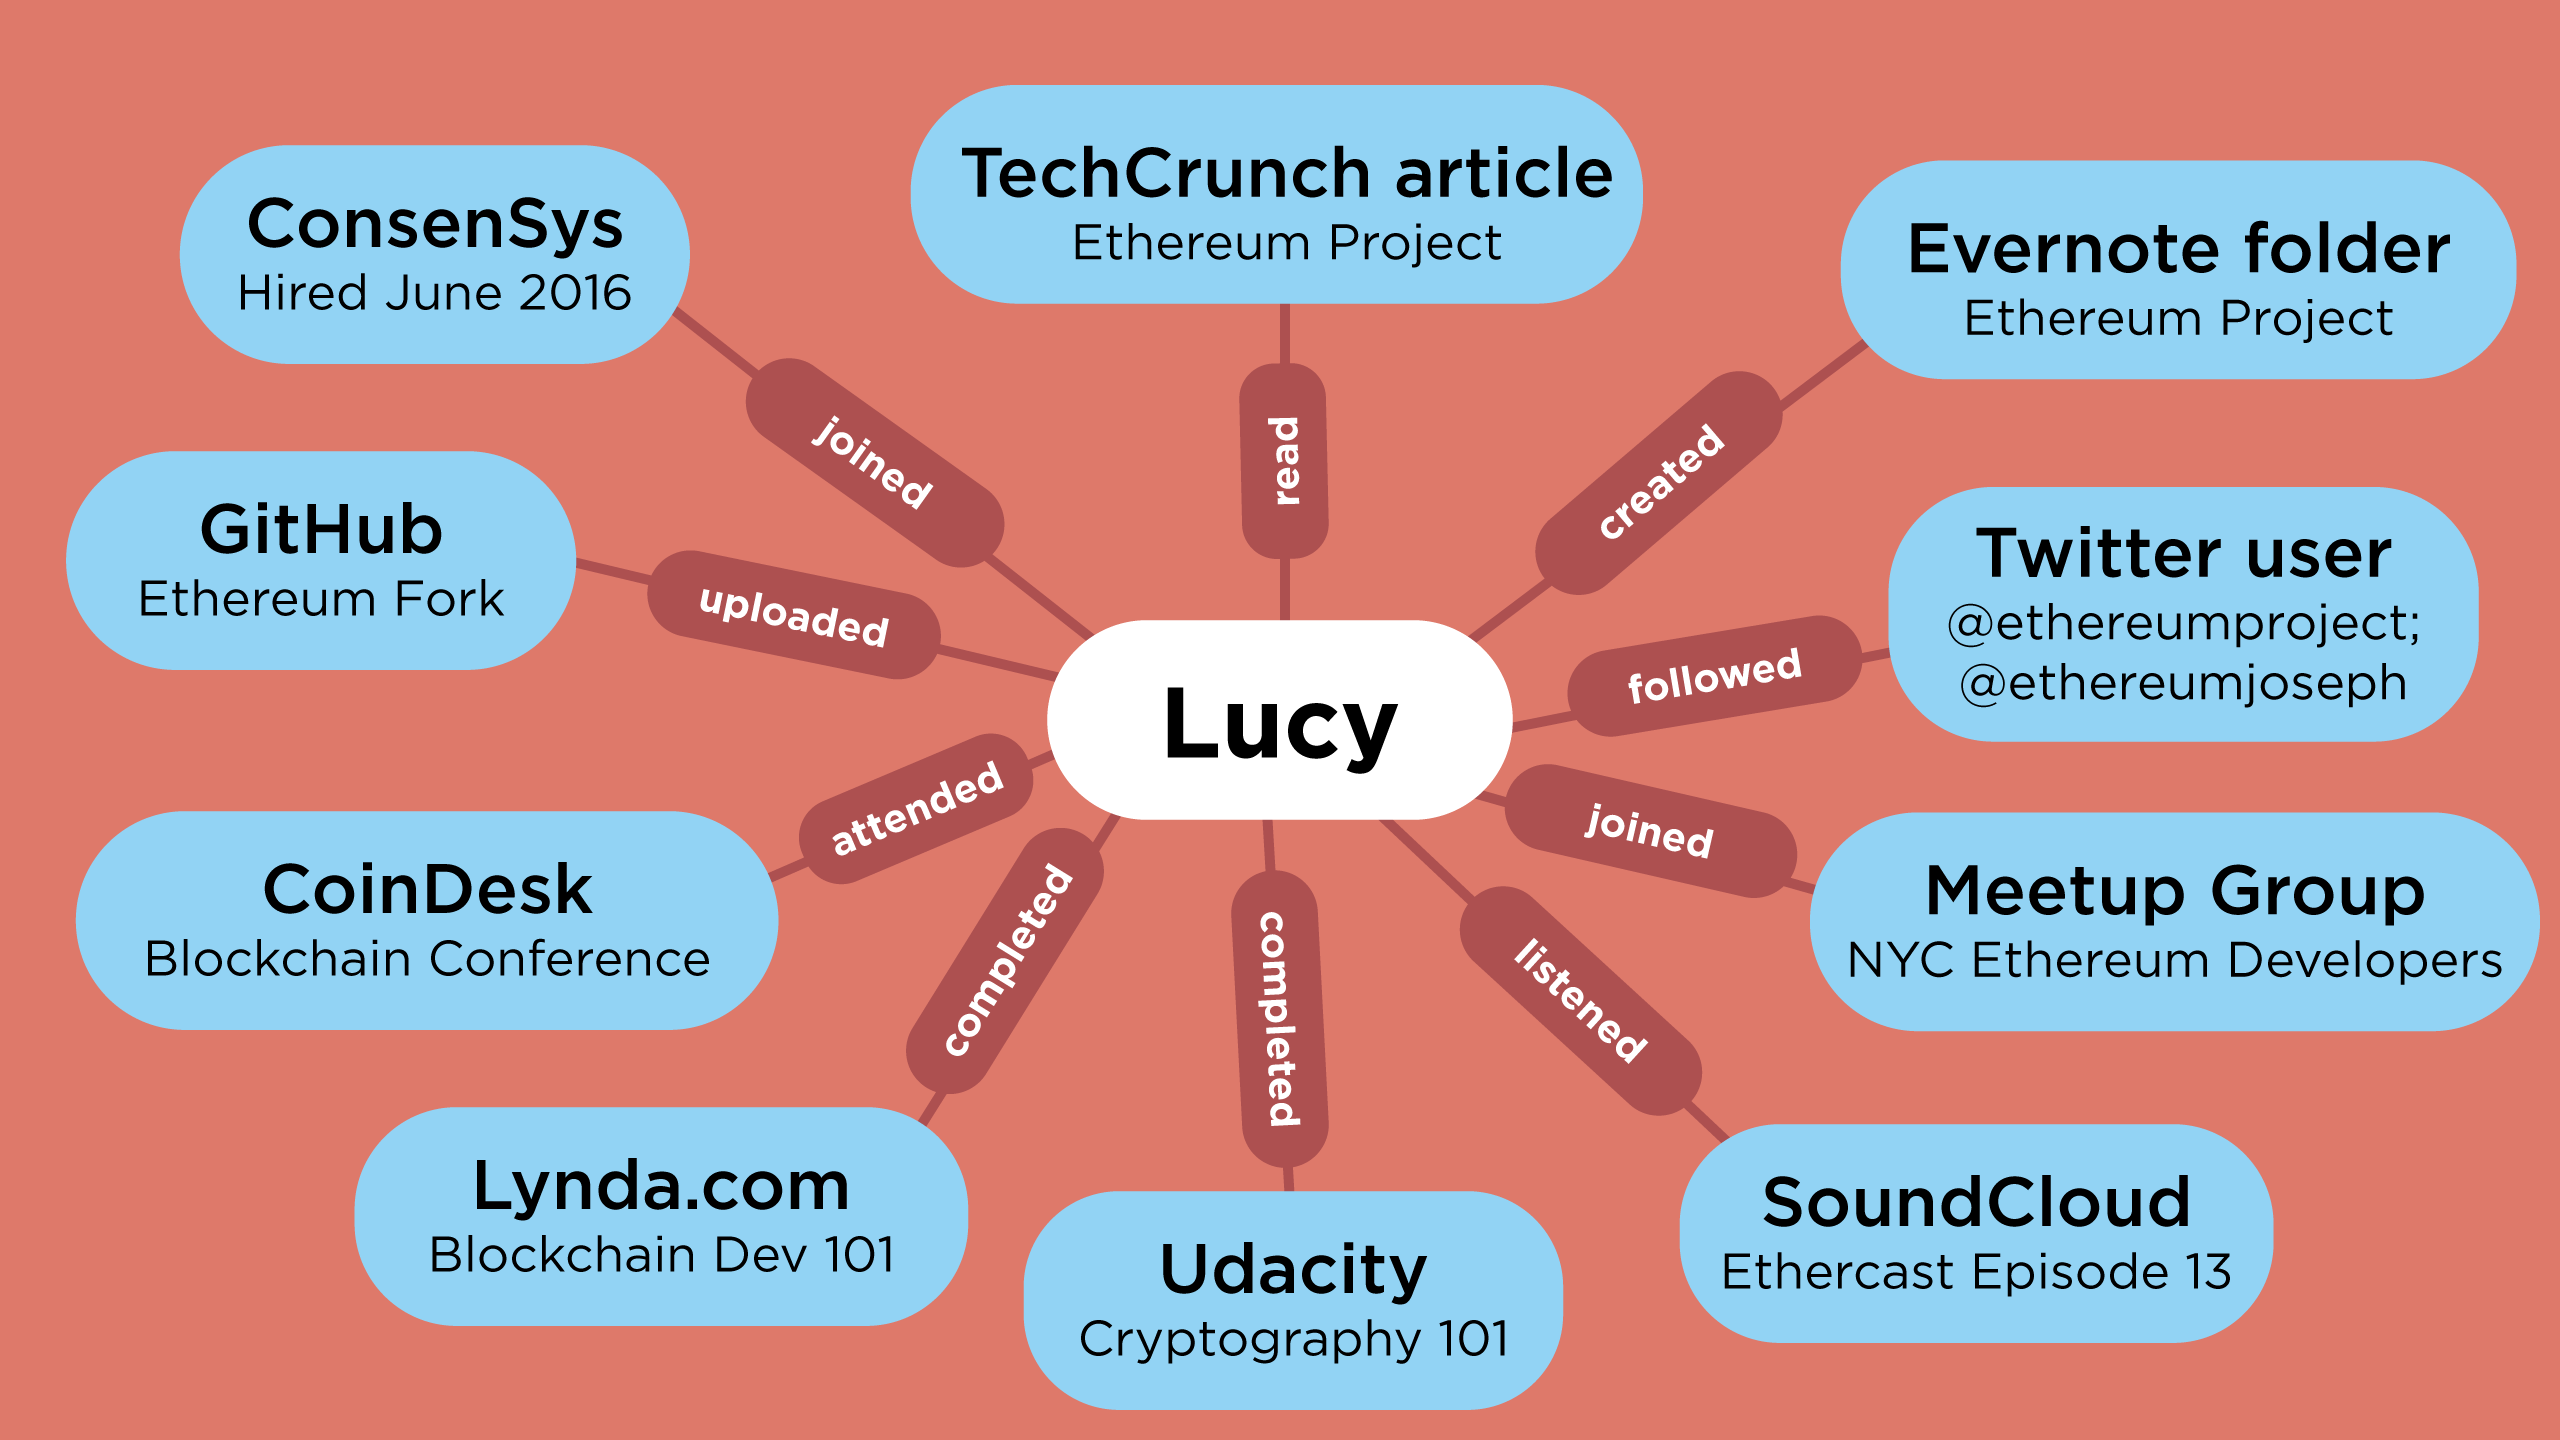
Only one of these statements — “hired at Consensys Inc.” — would likely appear on Lucy’s résumé. The experience graph would actually reveal the steps along Lucy’s journey: her curiosity (reading an article, following relevant influencers on Twitter); engagement with the developer community (attending a meetup and conference); application of knowledge (MOOC, GitHub). Over time, Lucy’s experience graph connects her behavior to outcomes like the code she wrote, the new job she landed and how that code might bring value to the company.
Sharing our experience graph could provide a learning path for others (i.e. attend this meetup, follow those people), and we could compare our experience graph to others’ to find new connections. Inside organizations, an experience graph of xAPI statements can show leaders how people learn, collaborate and achieve desired outcomes. If enough data is collected at an aggregate level, the world of machine-learning experts would have massive data sets to create intelligent assistants that might drive our learning in unique ways.
Ideally, xAPI provides data points on relevant lifelong learning and performance experience that can reveal insights into how we discover, explore, learn, try, fail and apply new knowledge. xAPI statements can reflect how we learned and with whom. Lucy might learn as much from Twitter conversations and YouTube videos as others in formal online courses, so identifying relevant experiences is part of the appeal of an xAPI-layered world of learning — and it’s also part of the creepy versus compelling dynamics of managing our own experience graph.
The path forward: creepy versus compelling
This vision of an experience graph is full of techno-solutionist thinking that tests our willingness to explore the creepy lines of privacy and the culture of quantified-self advocates who try to measure everything. The vision also contains elements of a very compelling future where we are empowered with real-world data that could drive understanding in how we learn and grow. It might be a compelling enough future to kill off the static résumé and replace it with a more dynamic experience graph of what we know and the skills we’re developing.
While a long list of questions and integration challenges is being addressed by both graph analytics and xAPI communities, we can currently explore the future through two perspectives: the skeptic’s and the enthusiast’s.
To the skeptic, an experience graph of xAPI statements may seem like another tech-overshoot trying to measure everything. Is this another quantified-self concept that will fall short of mainstream adoption? Is it a data set ripe for corporate abuse and privacy invasion? The skeptic may also point out that it’s wishful thinking to imagine millions of people building their experience graph with such momentum that the résumé actually becomes antiquated.
To the enthusiast (author included), the experience graph is an empowering opportunity to see how we learn and grow through connective experiences that drive actions which seem otherwise non-linear or irrelevant. Privacy issues will remain a challenge, but are likely to be resolved with emerging blockchain-based identity and data-integrity layers. The experience graph could become a competitive advantage for students applying to college and job-seekers eager to share real-world data with potential employers.
The adoption cycle and tipping point will likely follow the same path as the social graph. Early adopters lead the way for mainstream. Others will try to abuse or game the graph. Various power players will try to assert themselves and capture revenue from this quantified age of learning, training and performance. And, of course, many people will dismiss it, ignore it or refuse to participate.
For LinkedIn, the opportunity path seems clear. Start by developing an experience graph platform with the xAPI specification that allows portability to competing graphs. Replace the résumé’s chronological record of experiences with a dynamic, actively managed experience graph that uses a wide range of xAPI activity statements to paint a comprehensive picture of how we learn and grow. In addition to increasing the value of its professional graph and economic graph through xAPI data, LinkedIn could interface with users’ experience graphs and provide upskill recommendations via Lynda.com courses and beyond.
Imagining an xAPI future
LinkedIn is in the business of understanding relationships and getting the world to use graph analytics to reveal connections in the business world. Of all the major players in our digital brands, LinkedIn seems ideally suited to test-kill the résumé and explore its successor, the experience graph.
The experience graph could start a ripple effect across college and corporate campuses by shifting focus from the broad use of résumés to data-driven connections of demonstrated skills. It could also empower L&D leaders to call out the ineffectiveness of training in favor of just-in-time performance support. Headlines from the not-too-distant future might resemble the following timeline:
September 2018: LinkedIn Announces xAPI College Partnership. LinkedIn will partner with 10 colleges and universities to bring xAPI tools to campus-learning management systems like Blackboard and Moodle and via LinkedIn’s own proprietary internship platform. Professors and students will begin building out the world’s first set of experience graphs based on classroom work and internships. Skeptics and protesters emerge as they argue LinkedIn’s true intentions: selling college-student data to corporations at a profit.
February 2019: Chan Zuckerberg Initiative Funds Open Source Experience Graph (OxG). The Chan Zuckerberg Initiative announces plans to release an open source experience graph (OxG) platform available for free online. The blockchain-based system secures privacy and access to xAPI statements. The move ensures that open source xAPI graph tools exist as options to experience graphs from LinkedIn and Google, and which dominate the marketplace.
November 2020: Indian Institutes of Technology (IIT) Announce IBM Watson xAPI Partnership. IIT has signed a 10-year contract with IBM to bring IBM Watson with xAPI to all students on its campuses. IBM agrees to allow students to own their learning analytics and experience graph data.
September 2021: Supreme Court Ruling on Data Rights. Nation’s highest court rules in favor of individual ownership rights of learning and workflow data. Employers must receive permission to access xAPI data records. Business leaders say ruling will lead to higher costs of managing experience graphs or lead to more ad-supported learning programs.
September 2023: General Motors and Google: Résumés No Longer Welcome. Software giant Google and manufacturing titan GM announce that talent development will accept candidates’ experience graphs, not résumés.
Forecasting the push-pull scenario
Despite the résumé’s limitations, it is today’s default presentation of our skill sets. If the experience graph becomes widely used, it will require a “push” phase (2018-2023) from influential tech brands like LinkedIn, human resource professionals and early adopters such as the programming community. The “pull phase” (2023-2030) from the mainstream world of workers would likely come after large private and public sector organizations set higher expectations to move beyond the résumé and toward the nuanced data illustrated in an experience graph platform.
Just as the social graph emerged over the last 10 years as a valued platform for our digital lives, the next decade could signal the emergence of our personal experience graph — connected data of what we are learning and with whom — and how that knowledge translates to our real-world lives.


Comment