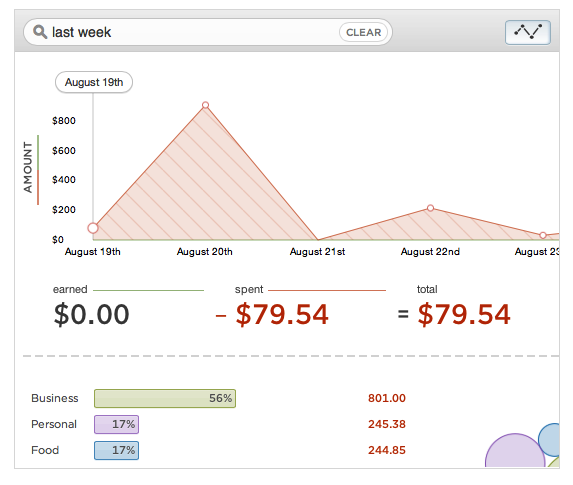
The startup known as Simple (formerly BankSimple) has been busy rolling out new features since its public debut earlier this summer. Last week, the company unveiled “savings goals,” to help users more easily set money aside. Today, Simple again moves further into territory that has previously been the domain of third-party financial services platforms, like the Intuit-owned Mint.com, for example, with the launch of a detailed, and also very visual, reporting feature.
Although Simple doesn’t actually call out Mint.com by name, the implication is there in the blog post announcing the new feature. Writes Simple’s Matt Sacks, “we have an advantage over third-party visualization tools: because Simple has access to the full feed of your data, there’s no middleman between you and reliable, real-time understanding of your spending.” In other words, Simple is calling Mint.com and competitors (think HelloWallet, InDinero, LearnVest, etc.) middlemen, a term which Internet-savvy folks associate with old-school, redundant means of doing business. That’s funny because these third-parties are generally startups themselves, not the out-of-date traditional businesses Simple aims to disrupt. (That’s the banks.) And it’s funny because Simple isn’t actually a bank – since accepting deposits would put Simple up against tough regulatory challenges for a startup, funds are held in FDIC-insured accounts at a partner bank. So I guess you could argue that Simple itself is kind of a middleman between where you and your money really lives.
Still, it’s one sexy middleman. And it’s one that acts as the front-end which customers associate with banking, so you never have to actually deal with the boring old institution where the money is housed.
As for the newly announced reports, like everything that Simple has introduced so far, they have an element of thoughtful design to them. The reports let banking customers see their trends over time, including things like deposits and spending, and they break things down into categories like “business,” “personal,” “food,” and other standard ways of organizing transaction types. This is information that third parties allow for more insight into, going all the way back to the days of desktop software where you manually trained applications that Merchant X went into Category Y.
The new reports are available on the fly for custom queries. Simple offers some examples of sample questions you can type into its search box. You can search for “this month” to see monthly trends, “under 100” to see small purchases, or “restaurants” to see trends by categories. If you’ve ever been stuck staring at your online bank account ledger in search of a transaction or just trying to make sense of your behavior, you know that this sort of feature could be hugely useful. With the report on the screen (Simple customers can use them now in the web app), you can also drill down into the transaction details, too, with the idea being that users need both the overview and the specifics in order to take action.
The reports are a nice, new addition to Simple, which has been working to on-board some 100,000+ waitlisted users as of July. You can add your name to the growing list from the company homepage here.


Comment