London based startup Timetric enjoyed the UK election night. They stayed up all night updating graphs. But seeing as their company intends to be a sort of ’statistics on speed’ platform, and they have funding, that seems appropriate.
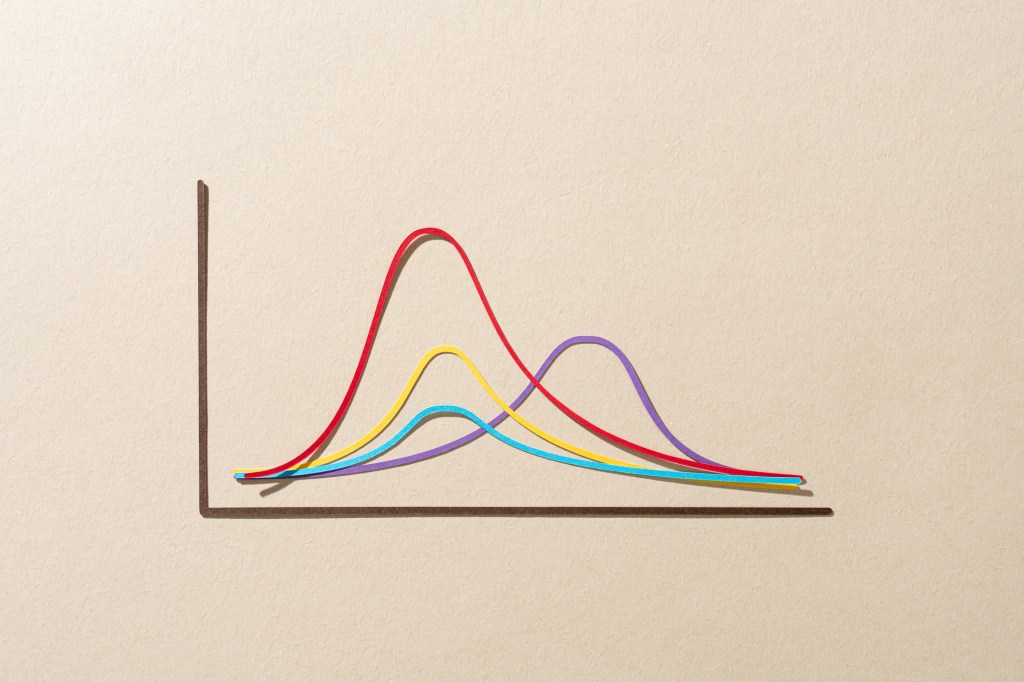
Below are the two graphs they’ve produced from the election results.
Perhaps he most interesting aspect is the performance of the Lib Dems. If you look at the two graphs below you can see the difference in shape of the Lib Dem (yellow) lines. These are dramatically different and thus shows that the number of seats they won is not entirely reflective of how much of the vote they actually succeeded in capturing.
In other words, a significant proportion of Lib Dem votes were “wasted”, as a result of the first past the post electoral system in the UK.
Nice graphs though huh.


Comment