Media & Entertainment

The digital age of data art

Comment

Image Credits:

Maxence Grugier

Contributor

Maxence Grugier is a French journalist specializing in new media art and digital art for more than 15 years, writing for Digitalarti Media and other publications.

Many artists use as material for art the raw data produced by our societies, seeking innovative means of display or transforming it into a work of art. By blurring boundaries between art and information, data art dispels the myth of the romantic artist while offering a fundamental artistic act in a critical commentary of the digital age in which we live.

An age that is supposedly open and yet increasingly obscure or incomprehensible to non-specialists. By re-appropriating these reams of information, or big data, data artists reintroduce fantasy to an age of increasingly abstract data and concepts.

The objective of data art is to create aesthetic forms and artistic works from the digital nature of the data generated from big data (graphics, simulations, worksheets, statistics, etc.). Any virtual data produced by our environment can be transformed into images, objects or sounds. Data art also presents the underlying links that exist between the ubiquitous algorithms in our lives — figures from databases, raw data, data collected by search engines, calculations and statistics (geographical, political, climatic, financial) and artistic creation.

Natural disasters around the world. Image from the exhibition EXIT. At the Palais de Tokyo (November 2015 / January 2016)
Natural disasters around the world. Image from the exhibition EXIT. At the Palais de Tokyo (November 2015 / January 2016).

Art and information technology are still unfortunately widely perceived as evolving in two conflicting worlds, but a new generation of artists working in the field of electronic media cannot afford to consider the world — and art — in these terms. Using media and IT tools is a creative process that is natural for them (this usually involves information technology: software development; programming; data analysis; algorithms; documentation and meta-data retrieval on the Internet, etc.).

This still-emerging aesthetic trend offers a new interpretation of the increasingly “mathematical” and rationalist world in which we live, re-enchanting the everyday life of homo technologicus. For these artists, this techno-scientific vision only touches the surface of another, much more complex, secret and marvelous world — a world that also speaks volumes, a world of data and information.

Algorithms and data flow

The world in which we live is almost entirely governed by algorithms. An algorithm is a sequence of computer instructions, applied systematically by a machine, or by software. In the past, an operator instructed a computer and commands were performed. With algorithms, the computer carries out automatic tasks alone, unassisted.

Some algorithms are the syndication’s key participants (subscription to a data flow; for example, RSS flow). They search for information and send it to the user registered on a “syndication feed.” Of course, other algorithms pick up the same data. These programs capture — and therefore propose — content, according to prior choices made by the user (on Google, Amazon, Facebook, Yahoo, etc.); these are flow aggregators and big data collectors.

The current quantitative explosion of digital data streams requires new ways for this information to be visualized. The processing of the research, retrieval, storage and analysis of this data is still an emerging sector, but it provides work for evaluation and analysis specialists, as well as for artists. Processing this extremely complex and diversified data is responsible for a brand new economic sector emerging in the field of information technology, along with new forms of artistic creation.

The treemap represents hierarchical data in a limited space, invented by Ben Shneiderman
The treemap represents hierarchical data in a limited space, invented by Ben Shneiderman.

Data visualization, the first step in data art

Data visualization has become a fundamental discipline as more and more businesses, local councils and public services are forced to invent visually amusing and striking ways to classify dig data generated by the movements in populations, their patterns of consumption, communication and travel, etc.

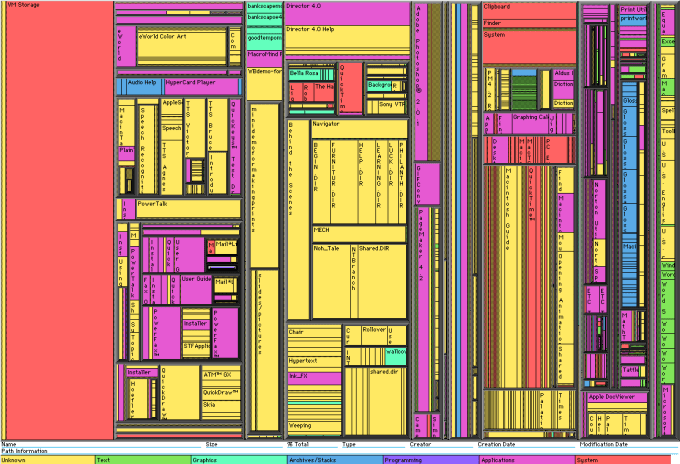
The first step in the world of data art consists of addressing how to view this data. Amongst the pioneers of this discipline, previously solely scientific and devoted to graphical representations of statistical data, are theorist Edward Tufte, responsible for the creation of sparklines (a concise graphic format developed for insertion in text), and Ben Shneiderman, who invented treemap in 1990.

Amongst the other graphical representation techniques and terminology, there are bar charts, pie charts (better known as Camembert or Donut Chart), scatter graphs, lines, bubbles, heat maps, (mapping of “hotspots”), etc. They all refer to the different ways of making visually attractive and, above all, understandable the reams of data (also called “datascapes”) that shape our everyday lives.

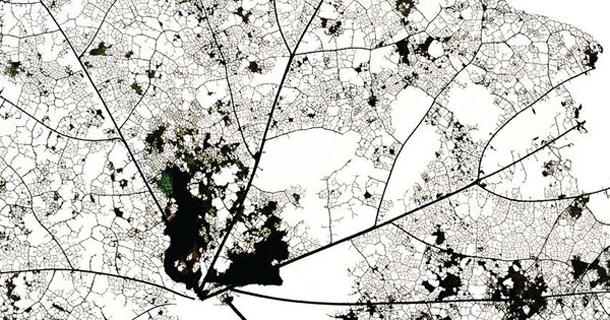
Data visualization, often generating extremely complex graphics, sometimes becomes artistic. Matt Willey, for example, draws inspiration from these forms with At This Rate and 2060 Poster, to show the impact of the economy and human activities on the environment.

 Matt Willey, 2060 Poster, Poster produced to raise awareness of the destruction of the Amazon rainforest.
Matt Willey, 2060 Poster. Produced to raise awareness of the destruction of the Amazon rainforest.

The origins of data art

To give a timeline to the origins of what is today known as data art (also called information art or informatism), reference should be made to the minimalist artist Kynaston McShine and his exhibition “Information,” given at the MoMA in 1970.

By choosing to present the combination of science, informatics and information technology with the most classical forms of art (including performance art, visual art, digital art and conceptual art), McShine proposes a first definition of data art. In the MoMA exhibition catalogue, he wrote: “Increasingly artists use mail, telegrams, telex machines, etc., for transmission of works themselves — photographs, films, documents — or of information about their activity.”

For Kynaston McShine, art and information already formed one single progressive movement, in a period literally “made of information.” Other signs of data art are also apparent amongst pioneers of generative art, an artistic form calling upon computer-generated creation via algorithms and computer language.

Mark Napier, Black and White, generative art ( 2003)
Mark Napier, Black and White, generative art (2003).

However, before the advent of today’s extremely complex forms of data art, there were works like those by the artist Mark Napier, part of the generative art movement, who produced Black and White, a work based on the stream of information captured by “Carnivore,” a software program developed by the FBI in the 2000s.

 Julian Oliver, Packet Garden Data Art, making the intangible visible
Julian Oliver, Packet Garden. Data Art, making the intangible visible.

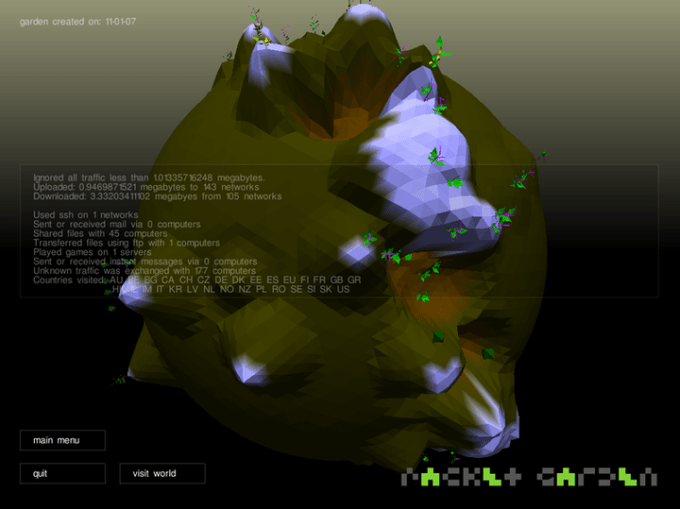
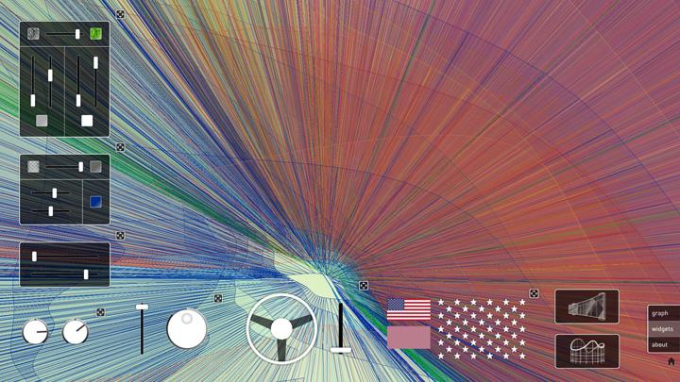
An increasing number of facets of our existence interact with each other through the multiple flow networks forming today’s information landscape. A historical and technological context that inspired Julian Oliver, for example, with Packet Garden, a project depicting our movements on the web portrayed as incredible engineered gardens, and Jason Salavon who, with American Varietal, offers a creative view of American ethnic plurality.

Jason Salavon, American Varietal,  2013 / Real-time interactive system, structural steel, multi-touch screen.
Jason Salavon, American Varietal, 2013 / Real-time interactive system, structural steel, multi-touch screen.

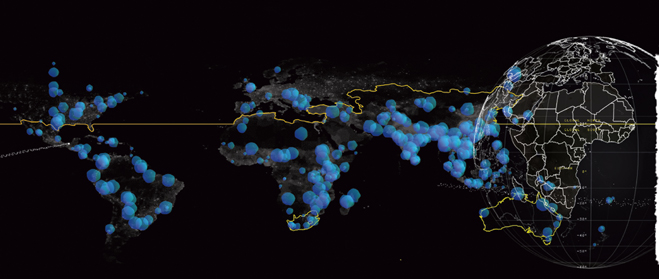
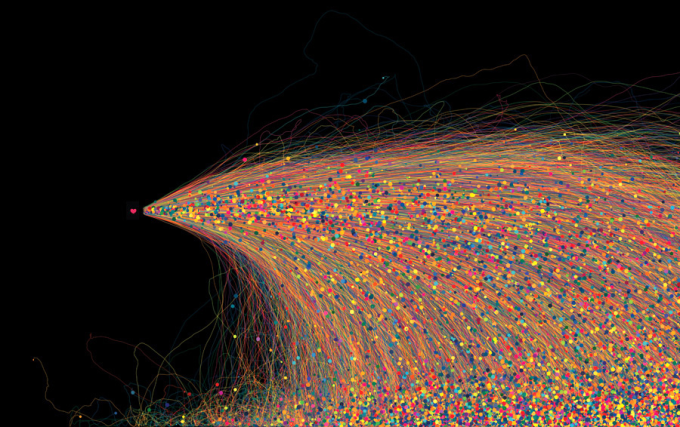
These intricately linked communication and movements are then assembled in huge databases by the algorithmic machine. This is what, for example, inspired one of the pioneers of data art, Aaron Koblin, with Flight Patterns (2009), a data art classic visualizing air traffic, a material representation of worldwide communication.

Flight Patterns – Color from Aaron Koblin.

Others, like the German artist Stefan Sagmeister, wish to resume the immaterial and abstract appearance of figures, streams and data recovery program. Move Your Money is a humorous, 3D inflatable metaphor — based on children’s bouncy inflatable castles — to make international monetary flows tangible.

Love Will Tear Us Apart Again, Peter Crnokrak
Love Will Tear Us Apart Again, Peter Crnokrak.

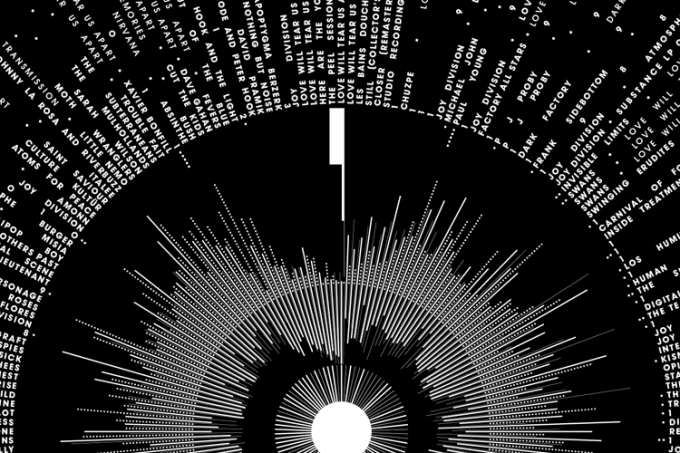
In a more amusing — and rock ‘n roll — way, with The Long Black Veil, the artist Jeffrey Docherty creates an intangible map of the 1980s Punk and New Wave scene. Love Will Tear Us Apart Again by Peter Crnokrak is a diagram of the emotional impact of the resumption of Joy Division hit Love Will Tear Us Apart in different countries and by different interpreters. With Serendipity in 2014, Kyle McDonald proposes a map connecting people listening to the same piece at the same time on Spotify.

Poetic flows

Creative apps and imagination are considerable in this field. The goal of data art, inspired by very down-to-earth techniques to visualize data, is above all to make the invisible visible. However, by formatting these reams of data, data artists are not content with making legible the mesh of information from which it is formed, they also take a critical look at our society.

By appropriating this intangible flow of data, data artists position themselves as observers and testify to behaviors, inferring details about mankind, the eternal demiurge — whether artists or sociologists, mathematicians or business men — for whom data collection indicates a compulsive need to control their even most abstract environment.

Jonathan Harris &Sepandar Kamvar, WeFeel Fine, net mapping the net collecting Internet sentences beginning with "I feel" or "I am feeling". Nearly ten million feelings and more than two million blogs were thus collected.
Jonathan Harris and Sepandar Kamvar, We Feel Fine, net mapping the net collecting Internet sentences beginning with “I feel” or “I am feeling.” Nearly 10 million feelings and more than two million blogs were collected.

However, with the evolution of generative graphics and data capture techniques, contemporary data art artists sometimes go beyond criticism to deliver instantly beautiful works of art that speak for themselves… almost.

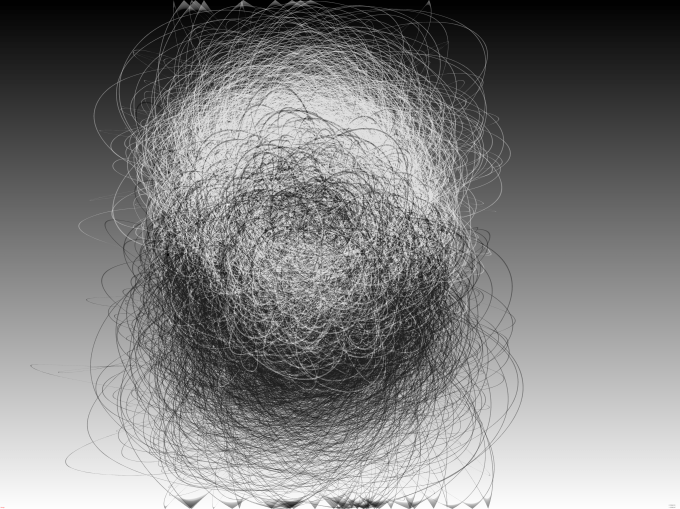
This is the case with Jonathan Harris and Sepandar Kamvar, with We Feel Fine, an exploration of human emotions, or Reynald Drouhin with Internet Protocol City, a generator of “ghost towns” transforming the IP addresses of Internet users into monochrome buildings, when abstract and cold data changes into the pure state of metaphoric beauty.

Jean-Baptiste Luneau and Malo Girod de l’Ain contributed to this post.

More TechCrunch

The Series C funding, which brings its total raise to around $95 million, will go toward mass production of the startup’s inaugural products

AI chip startup DEEPX secures $80M Series C at a $529M valuation 

A dust-up between Evolve Bank & Trust, Mercury and Synapse has led TabaPay to abandon its acquisition plans of troubled banking-as-a-service startup Synapse.

Infighting among fintech players has caused TabaPay to ‘pull out’ from buying bankrupt Synapse

The problem is not the media, but the message.

Apple’s ‘Crush’ ad is disgusting

The Twitter for Android client was “a demo app that Google had created and gave to us,” says Particle co-founder and ex-Twitter employee Sara Beykpour.

Google built some of the first social apps for Android, including Twitter and others

WhatsApp is updating its mobile apps for a fresh and more streamlined look, while also introducing a new “darker dark mode,” the company announced on Thursday. The messaging app says…

WhatsApp’s latest update streamlines navigation and adds a ‘darker dark mode’

Plinky lets you solve the problem of saving and organizing links from anywhere with a focus on simplicity and customization.

Plinky is an app for you to collect and organize links easily

The keynote kicks off at 10 a.m. PT on Tuesday and will offer glimpses into the latest versions of Android, Wear OS and Android TV.

Google I/O 2024: How to watch

For cancer patients, medicines administered in clinical trials can help save or extend lives. But despite thousands of trials in the United States each year, only 3% to 5% of…

Triomics raises $15M Series A to automate cancer clinical trials matching

Welcome back to TechCrunch Mobility — your central hub for news and insights on the future of transportation. Sign up here for free — just click TechCrunch Mobility! Tap, tap.…

Tesla drives Luminar lidar sales and Motional pauses robotaxi plans

The newly announced “Public Content Policy” will now join Reddit’s existing privacy policy and content policy to guide how Reddit’s data is being accessed and used by commercial entities and…

Reddit locks down its public data in new content policy, says use now requires a contract

Eva Ho plans to step away from her position as general partner at Fika Ventures, the Los Angeles-based seed firm she co-founded in 2016. Fika told LPs of Ho’s intention…

Fika Ventures co-founder Eva Ho will step back from the firm after its current fund is deployed

In a post on Werner Vogels’ personal blog, he details Distill, an open-source app he built to transcribe and summarize conference calls.

Amazon’s CTO built a meeting-summarizing app for some reason

Paris-based Mistral AI, a startup working on open source large language models — the building block for generative AI services — has been raising money at a $6 billion valuation,…

Sources: Mistral AI raising at a $6B valuation, SoftBank ‘not in’ but DST is

You can expect plenty of AI, but probably not a lot of hardware.

Google I/O 2024: What to expect

Dating apps and other social friend-finders are being put on notice: Dating app giant Bumble is looking to make more acquisitions.

Bumble says it’s looking to M&A to drive growth

When Class founder Michael Chasen was in college, he and a buddy came up with the idea for Blackboard, an online classroom organizational tool. His original company was acquired for…

Blackboard founder transforms Zoom add-on designed for teachers into business tool

Groww, an Indian investment app, has become one of the first startups from the country to shift its domicile back home.

Groww joins the first wave of Indian startups moving domiciles back home from US

Technology giant Dell notified customers on Thursday that it experienced a data breach involving customers’ names and physical addresses. In an email seen by TechCrunch and shared by several people…

Dell discloses data breach of customers’ physical addresses

Featured Article

Fairgen ‘boosts’ survey results using synthetic data and AI-generated responses

The Israeli startup has raised $5.5M for its platform that uses “statistical AI” to generate synthetic data that it says is as good as the real thing.

16 hours ago
Fairgen ‘boosts’ survey results using synthetic data and AI-generated responses

Hydrow, the at-home rowing machine maker, announced Thursday that it has acquired a majority stake in Speede Fitness, the company behind the AI-enabled strength training machine. The rowing startup also…

Rowing startup Hydrow acquires a majority stake in Speede Fitness as their CEO steps down

Call centers are embracing automation. There’s debate as to whether that’s a good thing, but it’s happening — and quite possibly accelerating. According to research firm TechSci Research, the global…

Retell AI lets companies build ‘voice agents’ to answer phone calls

TikTok is starting to automatically label AI-generated content that was made on other platforms, the company announced on Thursday. With this change, if a creator posts content on TikTok that…

TikTok will automatically label AI-generated content created on platforms like DALL·E 3

India’s mobile payments regulator is likely to extend the deadline for imposing market share caps on the popular UPI (unified payments interface) payments rail by one to two years, sources…

India likely to delay UPI market caps in win for PhonePe-Google Pay duopoly

Line Man Wongnai, an on-demand food delivery service in Thailand, is considering an initial public offering on a Thai exchange or the U.S. in 2025.

Thai food delivery app Line Man Wongnai weighs IPO in Thailand, US in 2025

Ever wonder why conversational AI like ChatGPT says “Sorry, I can’t do that” or some other polite refusal? OpenAI is offering a limited look at the reasoning behind its own…

OpenAI offers a peek behind the curtain of its AI’s secret instructions

The federal government agency responsible for granting patents and trademarks is alerting thousands of filers whose private addresses were exposed following a second data spill in as many years. The…

US Patent and Trademark Office confirms another leak of filers’ address data

As part of an investigation into people involved in the pro-independence movement in Catalonia, the Spanish police obtained information from the encrypted services Wire and Proton, which helped the authorities…

Encrypted services Apple, Proton and Wire helped Spanish police identify activist

Match Group, the company that owns several dating apps, including Tinder and Hinge, released its first-quarter earnings report on Tuesday, which shows that Tinder’s paying user base has decreased for…

Match looks to Hinge as Tinder fails

Private social networking is making a comeback. Gratitude Plus, a startup that aims to shift social media in a more positive direction, is expanding its wellness-focused, personal reflections journal to…

Gratitude Plus makes social networking positive, private and personal

With venture totals slipping year-over-year in key markets like the United States, and concern that venture firms themselves are struggling to raise more capital, founders might be worried. After all,…

Can AI help founders fundraise more quickly and easily?