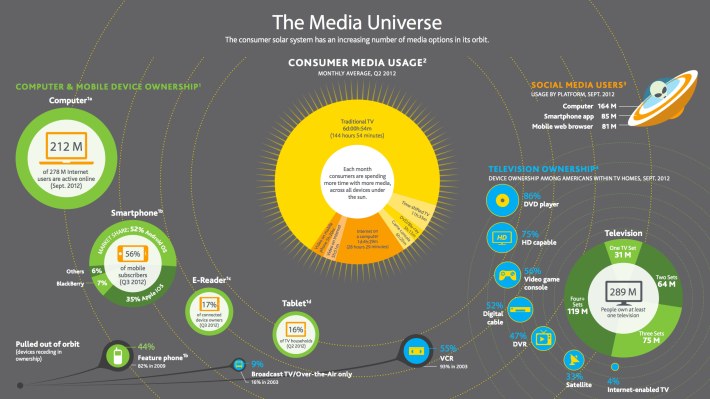
It’s not too late for yet one more 2012 year-in-review report, and today’s latest addition comes from Nielsen, which examined how Americans have been consuming content over the course of the past year. The report found that of the 289 million U.S. TV owners, 119 million own four or more television sets, making TV still the device to beat when it comes to watching and recording programs, among other things.
The TV-owning audience can also be further split up by how they access their programing and what sort of things they use their TV for, besides live viewing.
For example,
- 33% have satellite subscriptions, and 52% have cable; broadcast/over-the-air only is down from 16% in 2003 to 9%
- 47% have a DVR
- 75% have an HD-capable TV
- 56% play video console games
- 4% have Internet-enabled TVs
However, when it comes to how Americans are consuming media, it’s TV that’s still far in the lead. Traditional TV viewing eats up over six days (days! or 144 hours, 54 minutes) worth of time per month, the report found. Everything else – from computers to smartphones – is a much narrower slice of that overall pie:
- Internet on a computer: 28 hours, 29 mins.
- Online video: 5 hours, 51 minutes
- Video on mobile: 5 hours, 20 minutes
- Game console: 6 hours, 26 minutes
- DVD/Blu-ray: 5 hours, 13 minutes
- Time-shifted TV: 11 hours, 33 minutes
Somewhat hilariously, 55% of U.S. users also still own a VCR, too, but this is (thankfully) down from 93% in 2003.
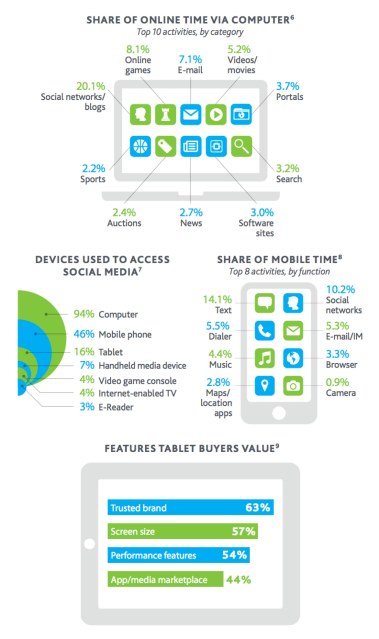
Computers also had a massive footprint in the U.S. with 212 million of the 278 million internet users active online in 2012. 94% of social media users accessed social media with a computer in 2012, says Nielsen. In terms of time spent on the computer, 20.1% was used for social networking and blogs – the most of any other category. Time spent for other categories is as follows:
- 8.1% online games
- 7.1% email
- 5.2% video and movies
- 3.7% portals
- 3.2% search
- 3.0% software sites
- 2.7% news
- 2.4% auctions
- 2.2% sports
Looking at those numbers for search and social, it’s hard to not see why Google had to develop a social platform with Google+, to take on Facebook. Even back in 2009, Facebook was eating up users’ time, accounting for over six hours of web usage per month to Google’s two hours, 24 minutes.
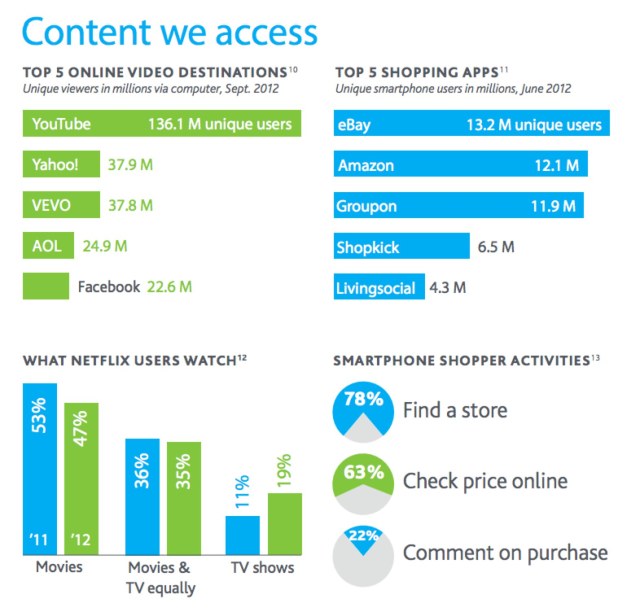
But one area where Google tops Facebook is online video, with 136.1 million uniques to Facebook’s 22.6 million watching videos on the site. Also showing: Yahoo with 37.9 million, VEVO with 37.8 million, and AOL (disclose: TechCrunch parent) with 24.9 million engaged in video.
In addition, as previously reported, Nielsen found that smartphones trump feature phones in terms of U.S. mobile adoption. Fifty-six percent of mobile subscribers owned a smartphone (as of Q3 2012), where Apple sees a 35% share, and Android and Apple combined account for 52% of smartphone devices. BlackBerry still holds a 7% share and “others” fills out the remaining 6%. The smartphone market is still growing, too: In a separate report from earlier today, Deloitte estimated that 2013 will be the first year that the industry ships 1 billion smartphones worldwide, bringing the total installed base of smartphones to nearly 2 billion. And yet another report – this one from Accenture – warned that the days of the feature phone are numbered, with decreasing ownership reported over the past several years.
Nielsen, too, sees feature phone declines, down from 82% ownership in 2009 to 44% in 2012 here in the U.S. Worldwide, Accenture reported 84% and 64%, respectively indicating feature phones’ still large install base in non-U.S. markets, and specifically developing countries, around the world.
Smartphone owners use their devices for shopping, says Nielsen. And specifically, this seems to refer to real-world shopping. 78% use the phone to find a store, 63% check prices, while 22% comment on purchases. Shoppers’ favorite apps are eBay (13.2 million unique users), Amazon (12.1 million), Groupon (11.9 million), Shopkick (6.5 million) and LivingSocial (4.3 million).
Tablets, meanwhile, were found in 16% of TV households, and 17% of connected device owners had an e-reader, too. Brand-name recognition matters to tablet owners, with 65% buying because it was a “trusted” brand. (Insert comment about being sheep here.) Fifty-seven percent considered screen size, 54% performance features, and 44% cared about the app and media marketplace.


