Measurement firm Nielsen today released new figures on second screen adoption, expanding on its research from October which mainly focused on the differences between men and women’s TV viewing behaviors. The “second screen,” for those unfamiliar, is the term now being bandied about to explain the trend of using a smartphone or tablet while watching TV.
According to Nielsen’s Cross Platform Report, one-fifth of U.S. homes are now tablet owners – a growing percentage, but one smaller than the 50 percent smartphone adoption Nielsen previously found among U.S. mobile owners.
Today, Nielsen says that 85 percent of mobile owners use their tablet or smartphone while watching TV at least once per month, and 40 percent do so daily. Breaking that apart, 41 percent use a tablet while watching TV daily, and 39 percent use a smartphone. This is actually a slight dip from before: in April of this year, Nielsen said that 45 percent used tablets daily.
What’s interesting with the new numbers is how the use of tablets is crossing the “age gap” when it comes to second screen adoption. The report states that 36 percent of those ages 35 to 54 years old and 44 percent of those ages 55 to 64 now use their tablets while watching TV to dive deeper into programming. Nearly a third of users ages 35 to 64 use tablets to check sports scores while watching games, and a majority of tablet owners use apps while watching TV.
The older age group (55-64) are also surprisingly the heaviest web surfers and email checkers on tablets while watching TV. However, overall, tablets as the preferred second screen device skews older – those 18 to 24 years old tend to use their smartphone during TV viewing, not a tablet. That makes sense because of the higher price points on tablets which make them still somewhat of a luxury purchase, while phones are more of an essential.
This younger group also tends to use smartphones for social networking (44 percent of 18-24 year olds do, and nearly 50 percent of 25-34 year olds do, too). But the biggest second screen activity on smartphones is not learning more about TV programming, it’s email – over 50 percent engage with email across all demographics. Shopping is also popular, with 29 percent of those 25-34.
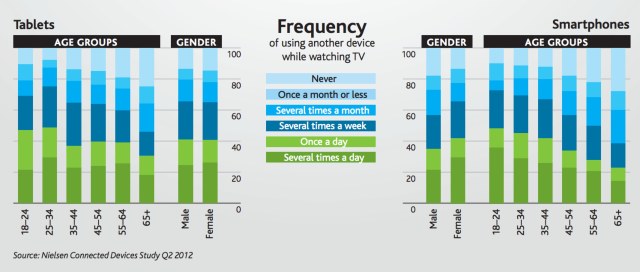
Nielsen again notes the gender divide, saying that over 40 percent of women use smartphones daily while watching TV, while men fall under 40 percent. The sexes are more even when it comes to tablets, though. (see chart)
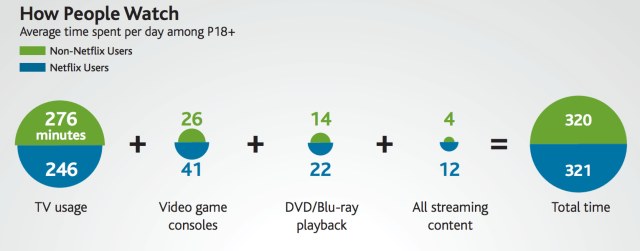
The report also dove into Hulu versus Netflix, finding that Netflix users consume the same amount of content as non-Netflix users (an average of 5 hours and 20 minutes per day, wow!). The difference is that Netflix users watch fewer TV minutes, spending more time watching on consoles, watching DVDs, and on streaming content.
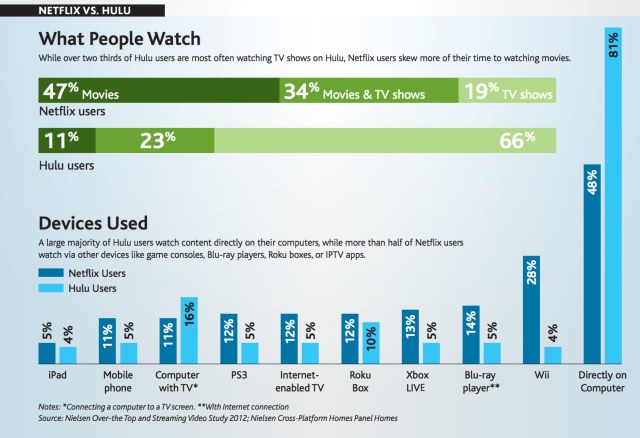
Hulu users use that service to watch more TV than movies or than both movies and TV, while more Netflix users tend to view just movies. Hulu users also tend to view the service on their computers (81 percent to Netflix’s 48 percent.)
More info on all these trends is now available in the full report here on Nielsen’s website.