Microsoft just announced earnings for its third fiscal quarter. Revenues were down 6 percent to $13.65 billion, and net income was down a whopping 32 percent to $2.98 billion or $0.33 EPS. Analysts consensus was closer to $14 billion for revenues and $0.39 for non-GAAP EPS, which Microsoft met thanks to its cost-cutting measures. Still, this can’t be feeling good for Microsoft.
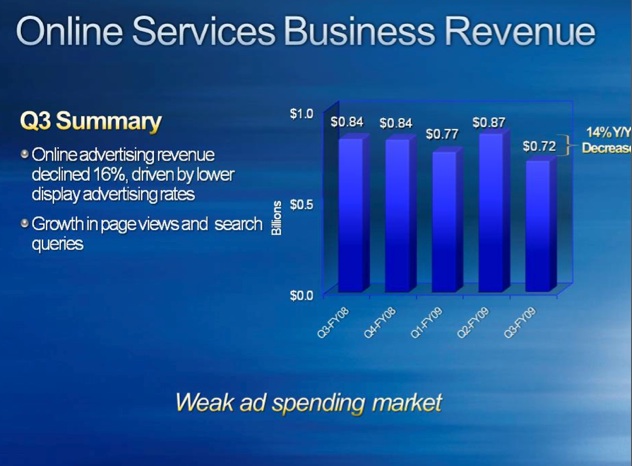
The company is exposed to the weaknesses in the economy in general, and soft demand for PCs and servers in particular. Revenues in its Client business (Windows) was down 15.6 percent to $3.40 billion. It’s servers and tools business proved the the healthiest with a 7 percent increase in revenues to $3.47 billion, marking the first time I believe that servers and tools brought in more revenues than the client business. The online business saw revenues decline 14.5 percent to $721 million, and its loss doubled to $575 million.
The online business suffered from a 16 percent decline in advertising revenues, driven by lower display ad rates. On teh bright side, page views and search queries on Microsoft sites were both up.
1.7 million Xbox360 consoles were sold in the quarter, up 30 percent, but revenues for the Entertainment and Devices business remained flat at $1.57 billion. And it actually dipped into an operating loss of $31 million.
Net cash from operations was $6 billion in the quarter, $1 billion less than a year ago, but Microsoft still ended the quarter with $25.3 billion in cash on its balance sheet.
Here is the breakdown in revenues and operating profits by business:
MICROSOFT CORPORATION
Segment Revenue and Operating Income (Loss) (In millions) (Unaudited)
Three Months Ended
March 31,
Nine Months Ended
March 31,
2009
2008
2009
2008
Revenue
Client
$3,404
$4,033
$11,604
$12,506
Server and Tools
3,467
3,238
10,616
9,381
Online Services Business
721
843
2,357
2,377
Microsoft Business Division
4,505
4,731
14,330
13,663
Entertainment and Devices Division
1,567
1,592
6,564
6,616
Unallocated and other
(16)
17
(133)
40
Consolidated
$13,648
$14,454
$45,338
$44,583
Operating Income (Loss)
Client
$2,514
$3,115
$8,689
$9,855
Server and Tools
1,344
1,080
3,978
3,170
Online Services Business
(575)
(226)
(1,521)
(737)
Microsoft Business Division
2,877
3,127
9,325
9,010
Entertainment and Devices Division
(31)
106
299
668
Corporate-level activity
(1,691)
(2,912)
(4,394)
(5,374)
Consolidated
$4,438
$4,290
$16,376
$16,592
And here is the main income statement and balance sheet:
MICROSOFT CORPORATION
INCOME STATEMENTS (In millions, except per share amounts) (Unaudited)
Three Months Ended
March 31,
Nine Months Ended
March 31,
2009
2008
2009
2008
Revenue
$13,648
$14,454
$45,338
$44,583
Operating Expenses:
Cost of revenue
2,814
2,514
9,569
8,732
Research and development
2,212
2,035
6,785
5,757
Sales and marketing
2,981
3,274
9,687
9,377
General and administrative
913
2,341
2,631
4,125
Employee severance
290
–
290
–
Total operating expenses
9,210
10,164
28,962
27,991
Operating income
4,438
4,290
16,376
16,592
Other income (expense)
(388)
520
(697)
1,254
Income before income taxes
4,050
4,810
15,679
17,846
Provision for income taxes
1,073
422
4,155
4,462
Net income
$2,977
$4,388
$11,524
$13,384
Earnings per share:
Basic
$0.33
$0.47
$1.29
$1.43
Diluted
$0.33
$0.47
$1.28
$1.41
Weighted average shares outstanding:
Basic
8,891
9,307
8,960
9,349
Diluted
8,904
9,428
9,008
9,492
Cash dividends declared per common share
$0.13
$0.11
$0.39
$0.33
MICROSOFT CORPORATION
BALANCE SHEETS (In millions)
March 31, 2009
June 30, 2008 (1)
(Unaudited)
Assets
Current assets:
Cash and cash equivalents
$7,285
$10,339
Short-term investments (including securities pledged as collateral of $1,445 and $2,491)
18,055
13,323
Total cash, cash equivalents, and short-term investments
25,340
23,662
Accounts receivable, net of allowance for doubtful accounts of $242 and $153
9,182
13,589
Inventories
657
985
Deferred income taxes
1,926
2,017
Other
3,619
2,989
Total current assets
40,724
43,242
Property and equipment, net of accumulated depreciation of $7,236 and $6,302
7,112
6,242
Equity and other investments
4,112
6,588
Goodwill
12,554
12,108
Intangible assets, net
1,756
1,973
Deferred income taxes
956
949
Other long-term assets
1,639
1,691
Total assets
$68,853
$72,793
Liabilities and stockholders’ equity
Current liabilities:
Accounts payable
$3,017
$4,034
Short-term debt
1,999
–
Accrued compensation
2,644
2,934
Income taxes
773
3,248
Short-term unearned revenue
10,924
13,397
Securities lending payable
1,533
2,614
Other
2,933
3,659
Total current liabilities
23,823
29,886
Long-term unearned revenue
1,388
1,900
Other long-term liabilities
6,699
4,721
Commitments and contingencies
Stockholders’ equity:
Common stock and paid-in capital – shares authorized 24,000; outstanding 8,898 and 9,151
61,896
62,849
Retained deficit, including accumulated other comprehensive income of $726 and $1,140