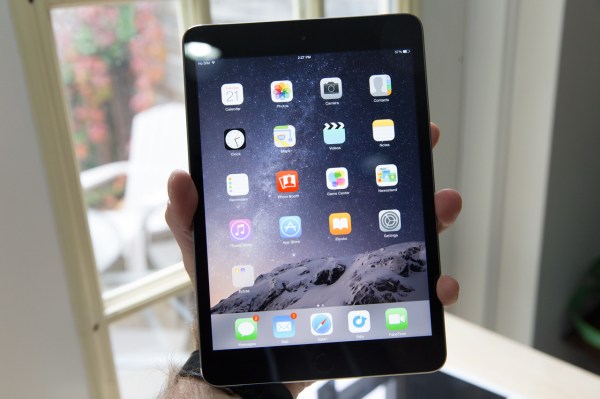
As Apple rides a cresting wave in the stock market with its market cap now dancing around $700 billion, a dark cloud moves in from IDC. The analysts report today that full-year iPad shipments will decline for the first time in its history, amid a sluggish market overall for tablets.
Apple — which ironically now offers more models of its iPad tablet than ever before — will ship 64.9 million iPad tablets in 2014, a decline of 12.7% on the total number of shipments a year ago. The bigger tablet market will see shipments of 235.7 million units, growth of 7.2% over 2013.
This is a big drop in growth. As a point of comparison, tablet shipments between 2012 and 2013 grew 52.5%.
Google’s Android operating system, following in the footsteps of its prevalence in the smartphone market, will continue to remain the most popular operating system for tablets. This year, it captured nearly 68% of the market, working out to almost 160 million devices shipped.
But this is not the whole story for OEMs. While Android will continue to keep its place as the leading operating system, Apple, with 27.5% market share, remains the single-biggest brand in the tablet market. IDC tells me that in Q3 specifically, Apple’s iPad had a 22.1% share.
So why the reason for the decline in tablet shipments? IDC appears to echo the observations of analysts like Gartner, who have been pointing out that tablets are following a sales cycle more akin to PCs than smartphones (fitting since it’s PCs that tablets are believed to be replacing).
“The tablet market continues to be impacted by a few major trends happening in relevant markets,” Ryan Reith, Program Director with IDC’s Worldwide Quarterly Mobile Device Trackers, writes. “In the early stages of the tablet market, device lifecycles were expected to resemble those of smartphones, with replacement occurring every 2-3 years. What has played out instead is that many tablet owners are holding onto their devices for more than 3 years and in some instances more than 4 years. We believe the two major drivers for longer than expected tablet lifecycles are legacy software support for older products, especially within iOS, and the increased use of smartphones for a variety of computing tasks.”
There are two other forces at play here besides replacement cycles impacting slower sales.
The first of these is that the new technology that is being introduced doesn’t appear to be compelling enough to attract new tablet buyers.
“Significant advancements have been made recently by hardware manufacturers to advance the 2-in-1, or detachable, product category,” IDC notes, along with thinner and less expensive devices. “Despite these advances, shipments of 2-in-1 devices are only expected to reach 8.7 million units in 2014, which is just 4% of the total tablet plus 2-in-1 market,” it notes.
The other reason? “Consumer hesitancy” around Windows 8, the platform on which the majority of 2-in-1 devices have been built.
There will be only 11 million Windows-based tablets shipped this year, accounting for less than 5% of the market, IDC says.
Looking forward, IDC highlights a few things that could come up in 2015 to impact the market: Windows 10 (that is if you believe Microsoft can do something significant to turn around its very slow start in tablets); Google’s work in both Android and Chrome OS; and potentially even more products from Apple. “Despite all of these unknowns, it seems clear that consumers can be expected to hold onto tablets longer than smartphones,” the company says.
The other interesting detail in IDC’s report is that emerging markets have overtaken mature markets this year for tablet shipments, accounting for 50.6% of the market. This speaks to how companies like Apple and Nokia (via Foxconn) are attempting to capitalize on the shift. Nokia, for example, will be selling the N1, its first tablet post-the Microsoft sale, in China first.
Worldwide Tablet/2-in-1 Shipments, Market Share, Year-Over-Year Growth, and 5-Year CAGR by Operating System, 2014-2018 (shipment volumes in millions)
| OperatingSystem |
2014* Shipment Volumes |
2014* Market Share |
2014* YoY Growth |
2018* Shipment Volumes |
2018* Market Share |
2018* YoY Growth |
2014-2018 CAGR |
| Android |
159.5 |
67.7% |
16.0% |
183.1 |
64.0% |
2.2% |
5.9% |
| iOS |
64.9 |
27.5% |
-12.7% |
70.1 |
24.5% |
2.2% |
-1.1% |
| Windows |
10.9 |
4.6% |
67.3% |
32.6 |
11.4% |
17.9% |
38.1% |
| Other |
0.5 |
0.2% |
-70.6% |
0.1 |
0.0% |
-11.3% |
-43.0% |
| Total |
235.7 |
100.0% |
7.2% |
285.9 |
100.0% |
3.8% |
5.4% |
Worldwide Tablet/2-in-1 Shipments, Market Share, and 5-Year CAGR by Region, 2014-2018 (shipment volume in millions)
| Region |
2014* Shipment Volumes |
2014* Market Share |
2014* YoY Growth |
2018* Shipment Volumes |
2018* Market Share |
2018* YoY Growth |
2014-2018 CAGR |
| Emerging Markets |
119.3 |
50.6% |
11.5% |
149.4 |
52.2% |
4.5% |
6.9% |
| Mature Markets |
116.4 |
49.4% |
3.1% |
136.6 |
47.8% |
3.0% |
3.9% |
| Total |
235.7 |
100.0% |
7.2% |
285.9 |
100.0% |
3.8% |
5.4% |
Source: IDC Worldwide Quarterly Tablet Tracker, November 25, 2014
