
What a difference a year makes. If you are looking for proof, go no further than OpenView Venture Partners’ 2022 SaaS benchmarks report, which couldn’t be more different from the 2021 edition.
Both reports come from an annual survey of SaaS companies, and with 660 global respondents, the 2022 sample doesn’t look very different from last year. But boy, the mood has changed.
Among other findings we’ll dive into shortly, OpenView learned that “an overwhelming majority of respondents are slashing spending regardless of cash runway.”
This need to cut cash burn is of course an answer to the public SaaS selloff and the “whiplash” that ensued. Being set off by macro concerns, there’s no reason to think that it won’t continue for some time, which explains why companies are gearing up.
Founders don’t just need to cut burn, though — they also need to turn their startups into the kind of companies that investors will back, and that’s definitely not the same as it was in 2020 or 2021.
But then, what does a great SaaS company look like these days? And how to become one? Well, benchmarks are a good start to answering these questions — knowing what the top of the class is doing can help other entrepreneurs steer their companies in the right direction.
OpenView has some how-to advice on the nitty-gritty, too, which we discussed with the report’s co-authors, operating partner Kyle Poyar and senior director of growth Curt Townshend.
“One thing that we saw in talking to CFOs, as well as looking at the data,” Townshend said, “is that it’s just a really hard time to be a founder today — and you need to be very, very specific about where you’re going to put your dollars.”
Let’s explore what the answer(s) might be.
The Rule of 40 is back
The reasons why market conditions for SaaS companies have radically changed are pretty well known at this point. So we won’t dive once again into the macroeconomic factors that caused the public selloff and its manifestations, but please bear with us as we repeat ourselves on another point: The balance between growth and profitability has shifted in investors’ hearts.
This shift in preference is best illustrated by the ebbs and flows Rule of 40, which states that the sum of year-on-year growth plus profitability expressed in percentage of revenue should exceed 40.
In 2021, we quoted OpenView observing that “investors have forgotten all about the Rule of 40.” Fast-forward one year, and “the Rule of 40 is back,” the firm says.
This isn’t exactly news: Just last week, Alex and I mused about the “rebalancing away from quicker growth and staggering losses toward merely rapid growth and less cash burn.” But it is still worth pondering because of what it means for public companies and their private peers.
OpenView has a pretty telling graph on how this rebalancing looks for public companies:
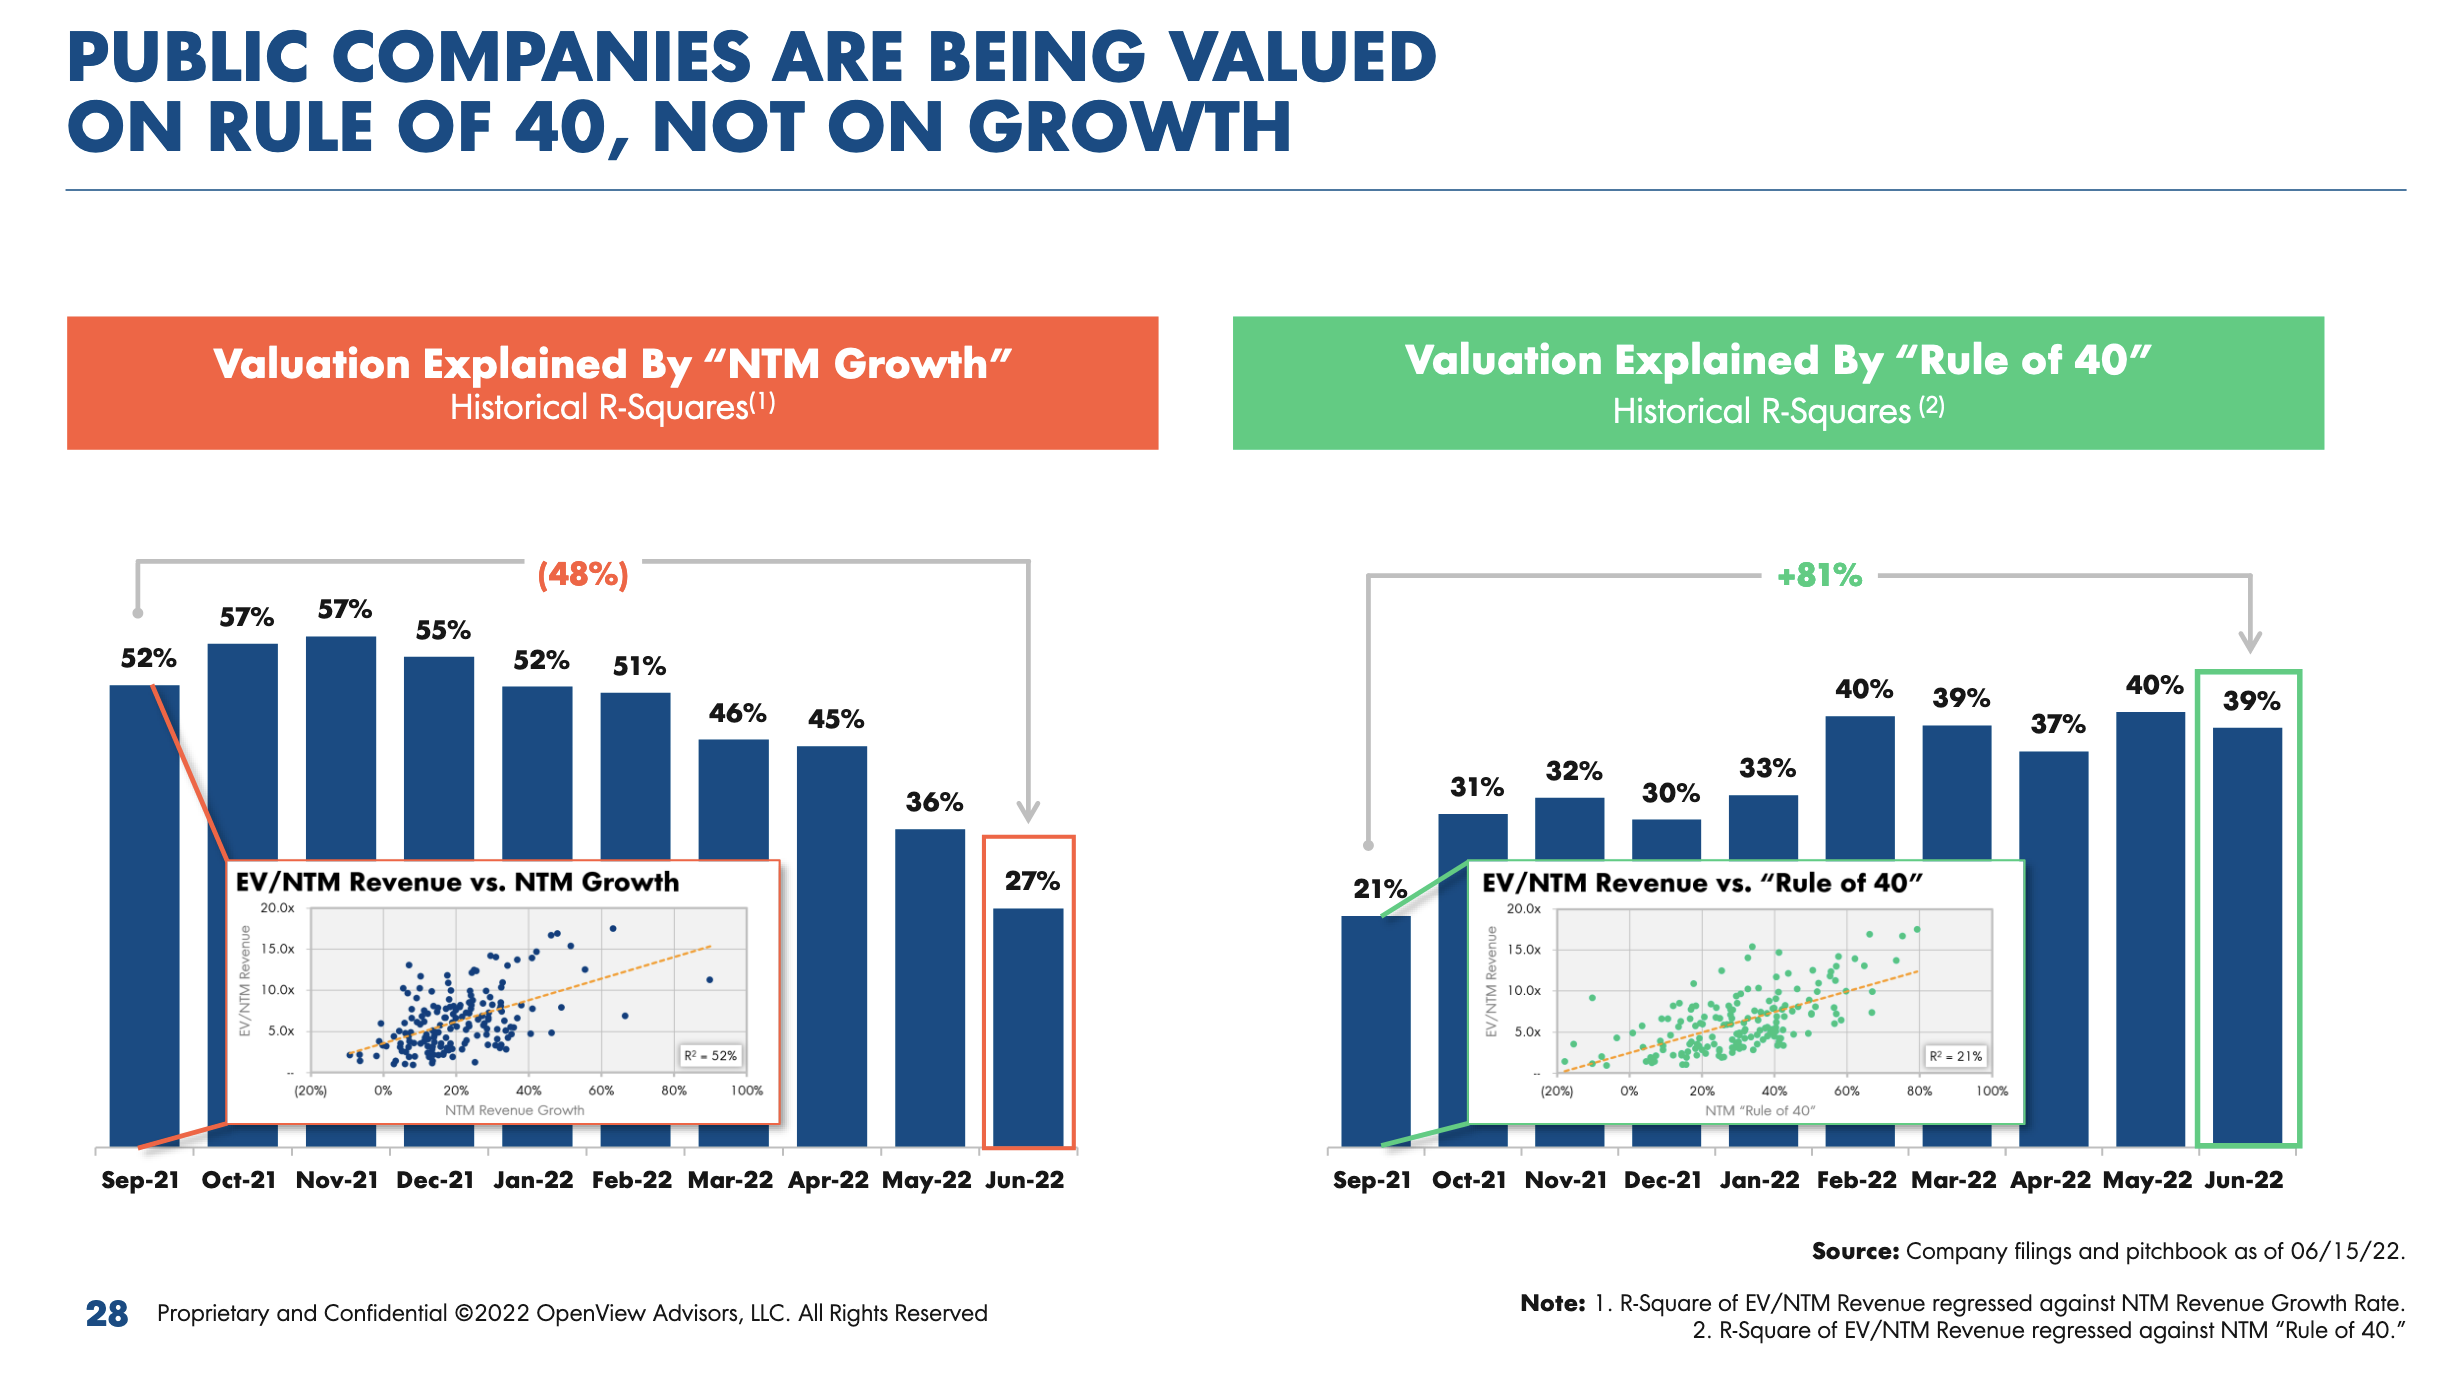
Image Credits: OpenView
For still-private SaaS companies, it means forgetting about growth at all costs, which no longer gets rewarded enough to be worth the risk. Still, OpenView doesn’t think that the Rule of 40 is absolute. “Achieving 40 each quarter is not required,” the authors wrote. “But it is required to have a grasp on what caused a drop or spike, and what can be done to get to 40 long term.”
The statement above reflects the report’s focus: Beyond a summary of public market data, it is meant to be actionable by founders wondering how to correct their course.
Finding benchmarks
The multibillion-dollar question for unicorns is how to get back on the IPO track with the type of metrics that are now required. But IPOs don’t happen from one day to another, which is why benchmarks make a lot more sense when broken down by stage.
In OpenView’s report, “stage” can mean two things; some slides break down the data by range of annual recurring revenue, while others do the same by funding stage. But in both cases, metrics show median, bottom and top quartile performance.
I find the breakdown by stage to be quite telling as to what it takes to raise funding nowadays. (Bold shows the median performance, followed by bottom and top quartile.)
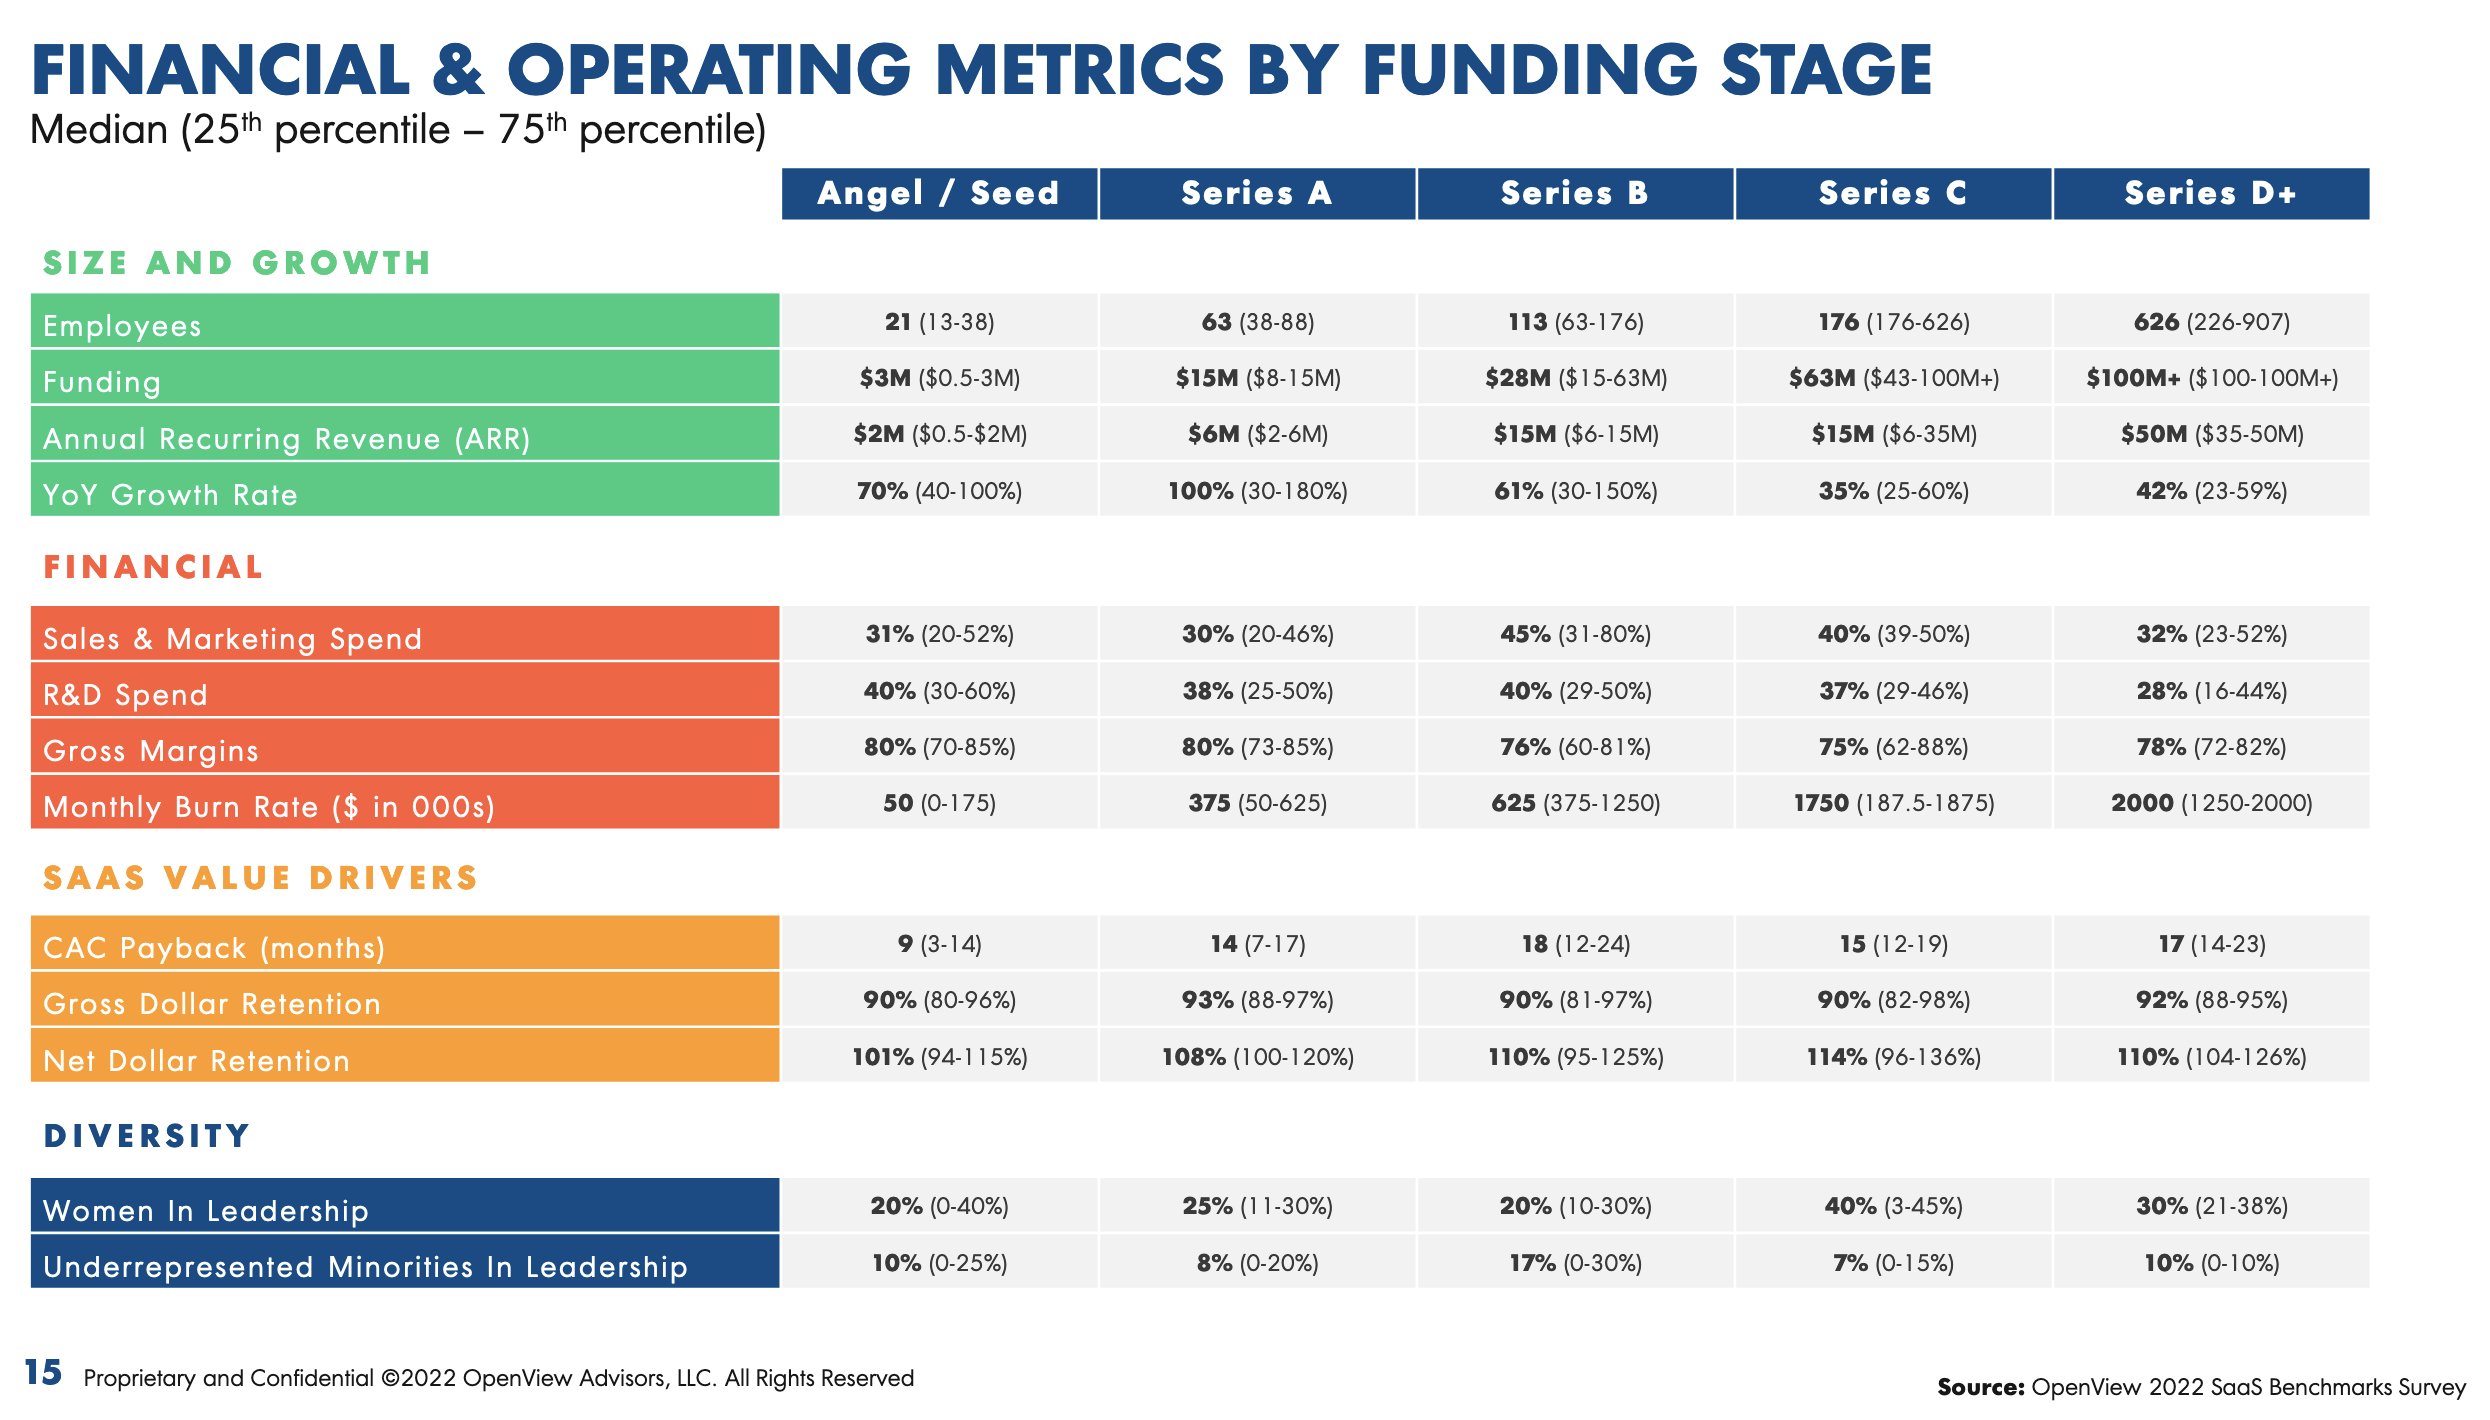
Image Credits: OpenView
The year-on-year comparison later in the report, which was conducted in July and August, is also quite telling, although most variables appeared pretty much as you’d expect.
“What’s changed since then is that it appears buying markets have softened from when we ran the survey. You probably see that called out in some of the recent earnings calls over the last couple of weeks, like HubSpot’s,” Poyar said.
For example, he added, “cycles are lengthening, there’s more people involved in approving a deal, even including board members and CEOs. And we didn’t see that scrutiny as much back in Q2, so it was starting in Q3.”
But even in Q2, founders at all stages were working on extending their runway — and even more so than OpenView expected.
“It was really interesting to see concrete data on just how many companies are actually cutting back,” Townshend said. “And that regardless of how much runway you have, there’s still urgency to build in optionality and figure out what is the right path to be taken and what are the right bets to make. In the past, it was a lot easier to justify making certain bets, because growth was just worth so much. And now that it’s worth less, and investors are focusing more on things like efficiency and balance, most notably in the Rule of 40, it’s just something that requires a fine-tooth comb.”
However, I was surprised that sales and marketing spend had remained level for companies with ARR below $50 million. OpenView anticipates that this will change “as startups begin to focus on more efficient and reliable routes to market,” and this is something we will keep on tracking.