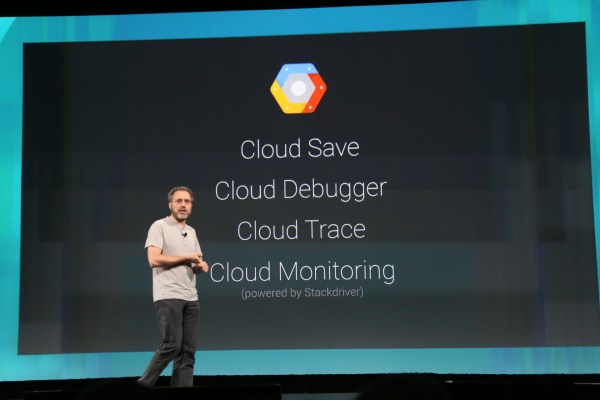
A few months ago, Google acquired the up-and-coming cloud monitoring service Stackdriver with the intent to integrate it into its own cloud tools. It didn’t take the company all that long to make use of Stackdriver’s expertise, because it launched its first product based on the company’s technology at its I/O developer conference today.
Google Cloud Monitoring, as the new service is called, provides developers with metrics, dashboards and alerts for apps that run on Google’s cloud, as well as information about popular open source services like Apache, Nginx, MongoDB, MySQL and Redis.

In many ways, this is similar to the kind of functionality that other cloud-monitoring services like New Relic offer. But unlike these other companies, Google is clearly focused on its own services, though it’s good to see that it will continue to support some other applications. While Stackdriver had a strong focus on Amazon Web Services, though, I wouldn’t expect Google to add the ability to watch your EC2 instances anytime soon.
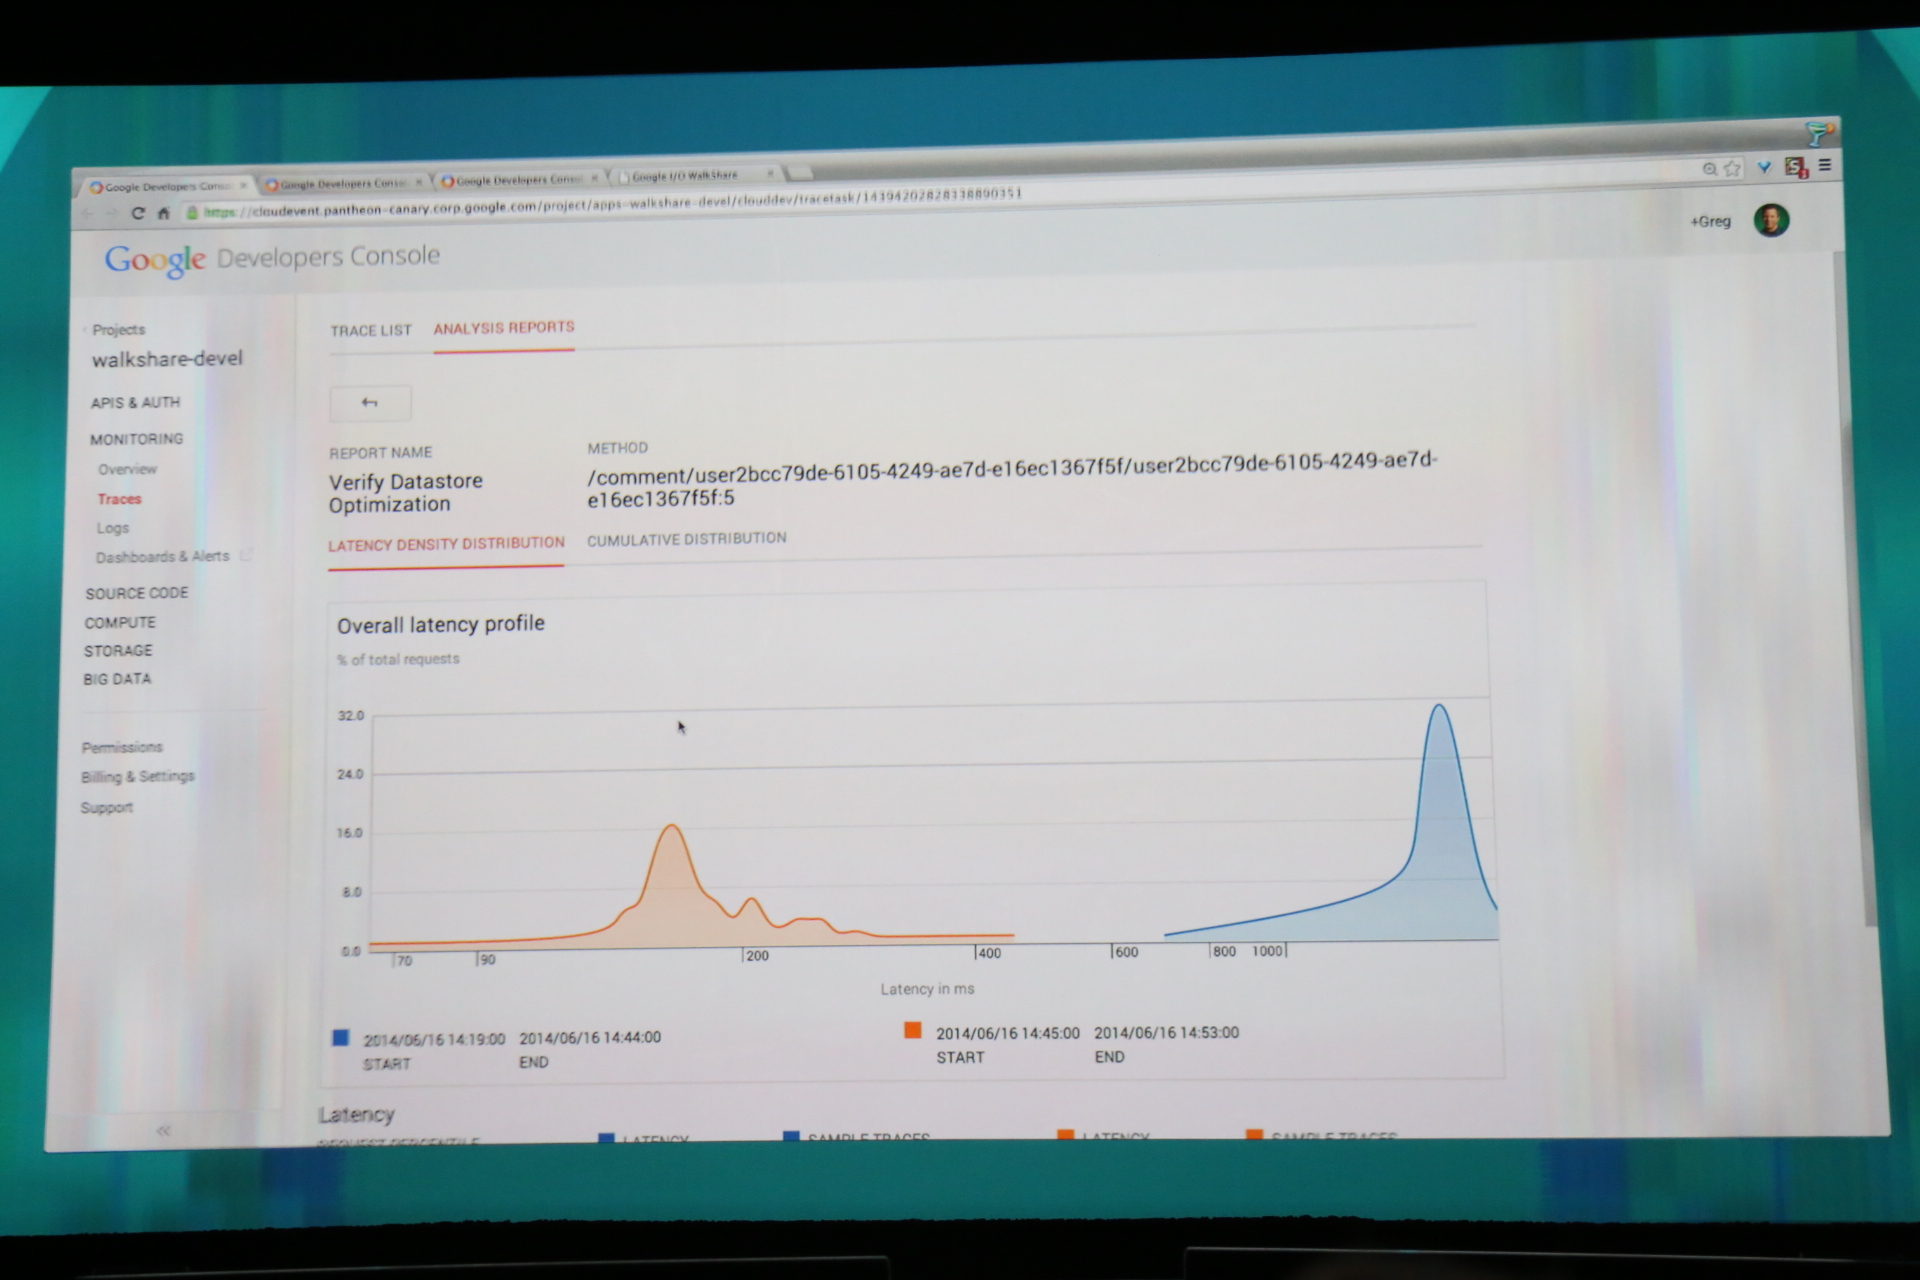
This isn’t the only monitoring feature Google is launching. Cloud Trace allows developers to more easily visualize the time their apps spend on request processing. It also makes it easy to see how an app’s performance changed between different releases.
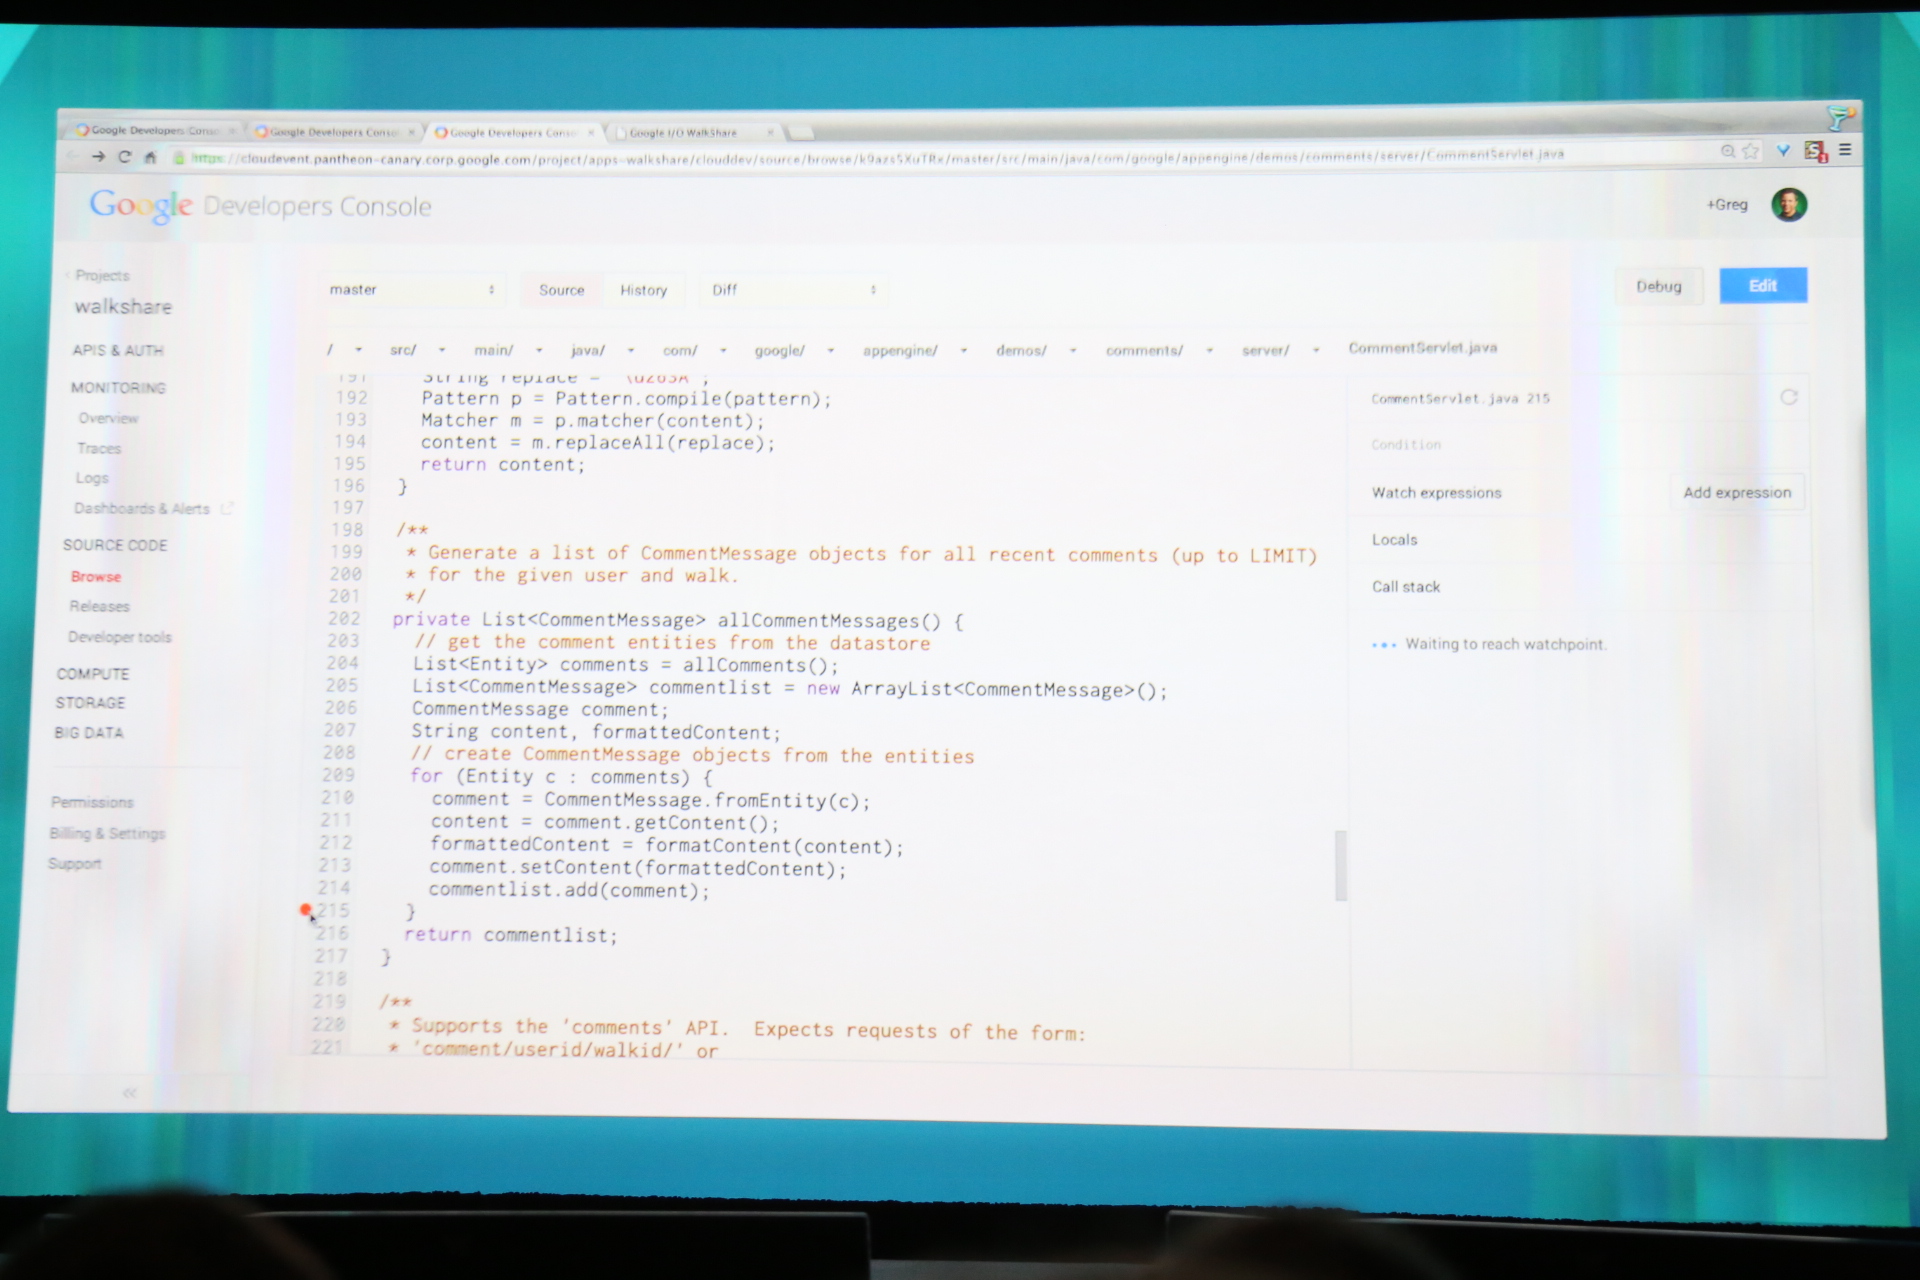
In addition to these two tools, Google also launched Cloud Debugger today. The company says that this will bring modern debugging to cloud-based applications. Cloud Debugger, Google says, will “give you a full stack trace and snapshots of all local variables for any watchpoint that you set in your code while your application continues to run undisturbed in production.”
In a demo during today’s I/O keynote, Google showed how developers can use this to find bug — a font issue in this case — by setting a watch point in the production code in the Developer Console, for example.