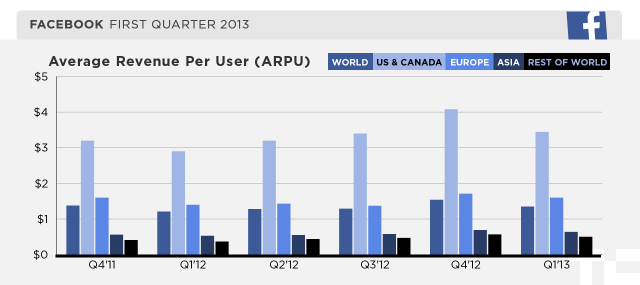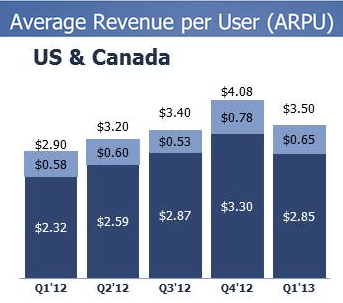
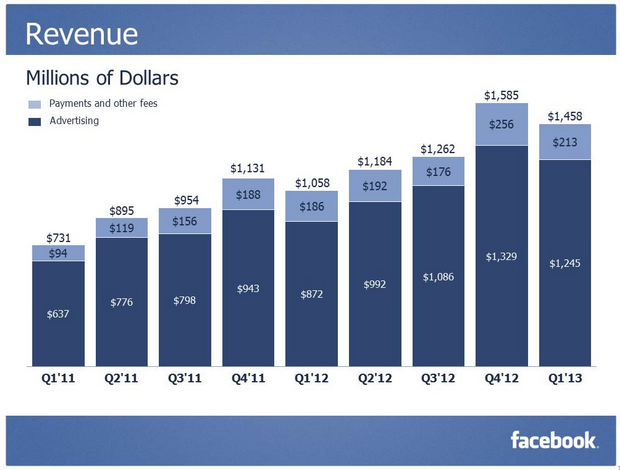
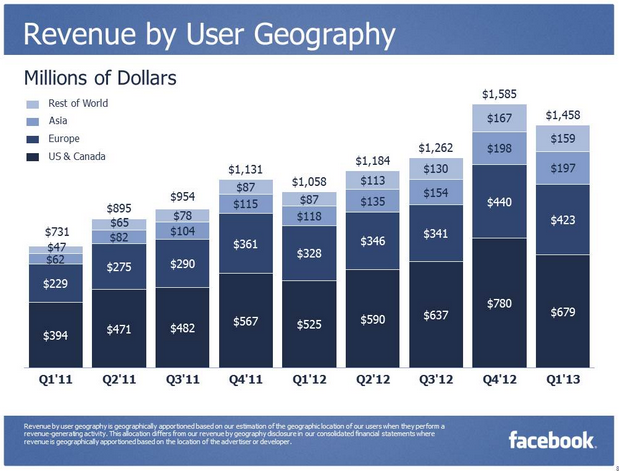
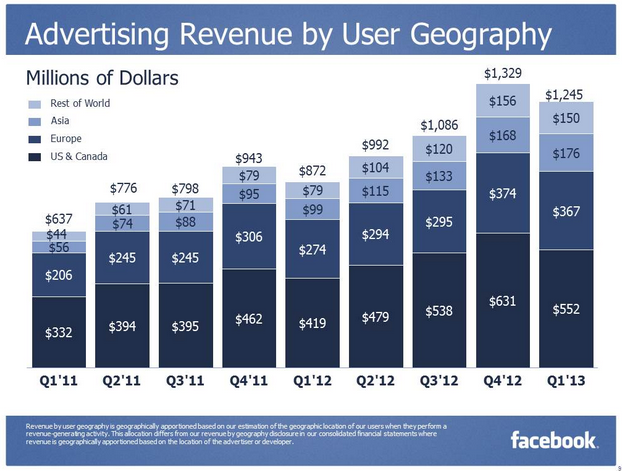
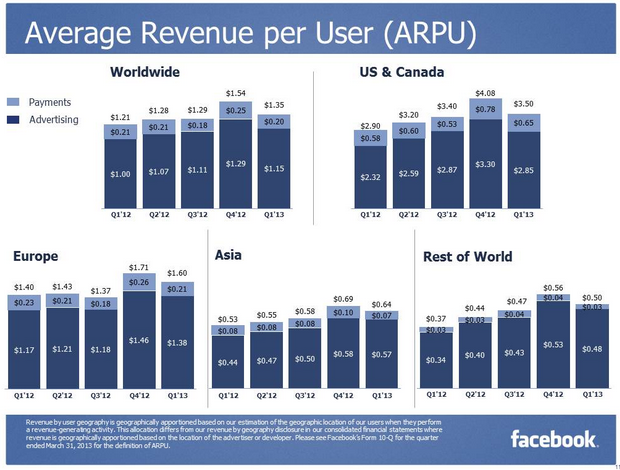
It appears that as people switch from the desktop where Facebook shows multiple ads per page to mobile, Facebook is earning less ad revenue per user in its most important markets. While user growth helped total revenue increase, in the US and Canada Facebook earned $2.85 on ads per user (ads ARPU) in Q1, down from $3.30 in the holiday Q4 2012, but also down from $2.87 in Q3.
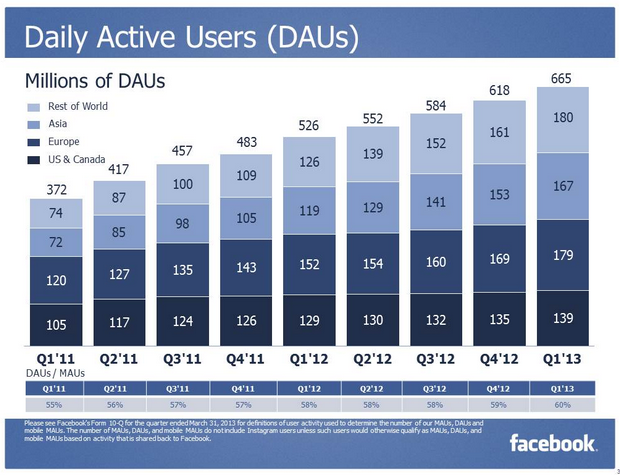
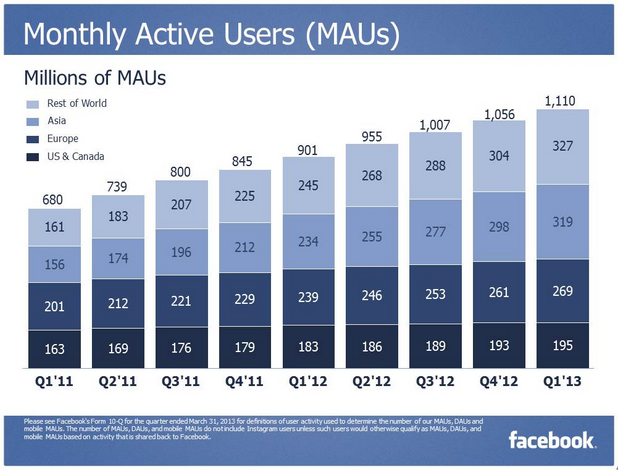
Another important stat is that Facebook’s monthly active and daily active users in the US and Canada increased, despite erroneous recent claims from third-party data providers and critics that Facebook had lost users in US. That’s critical because the US and Canada are where Facebook earns the most money per user.
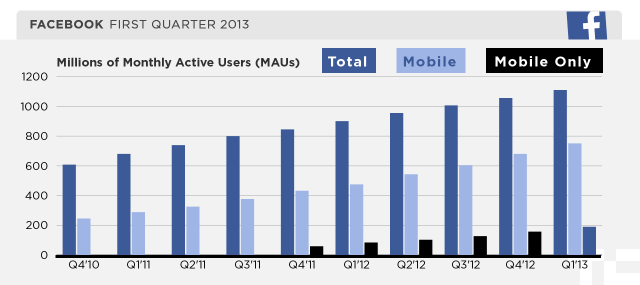
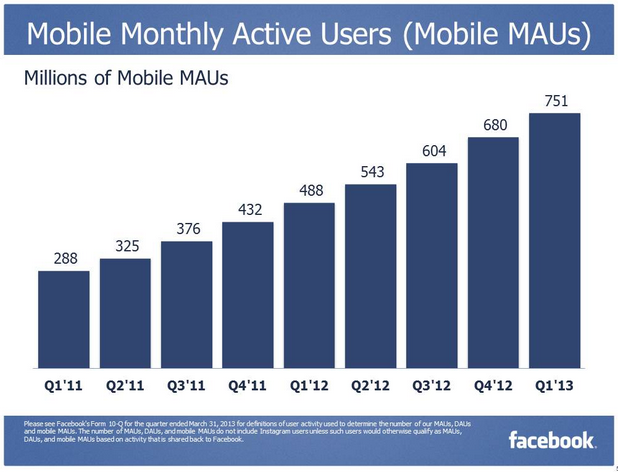
One graph we wish Facebook would release is mobile user counts by geography. This could show whether developing markets coming online mobile-first are responsible for its huge surge to 751 million mobile monthly users from 680 million in Q4 2012.
Check out the rest of these graphs for detailed stats on Facebook’s user growth, income, expenses, and more.
ANd here are our own Bryce Durbin’s graphs that sum up Facebook’s earnings:
 <
<