After last quarter’s accidental midday earnings leak, which sent its stock price down and halted trading, Google released its Q4 2012 earnings today right on schedule. But that’s not to say there wasn’t any confusion this time around. For Q4 2012, the company reported revenues of $14.42 billion for the quarter ending Dec. 31, 2012, up 36 percent from Q4 2011. Non-GAAP EPS in the fourth quarter of 2012 was $10.65, compared to $9.50 in the fourth quarter of 2011.
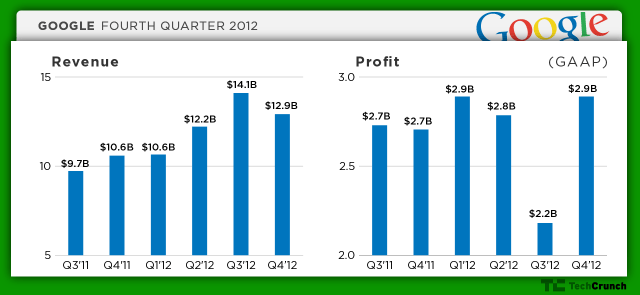
GAAP net income, including net loss from discontinued operations in the fourth quarter of 2012, was $2.89 billion, compared to $2.71 billion in the fourth quarter of 2011.
Analysts had pegged Google to post solid revenue and profit gains, citing online advertising growth and an improved position in the mobile market. They had been expecting profit of $10.57 a share on revenue of $12.38 billion for the fourth quarter, up from $9.50 a share and $8.13 billion in revenue from Q4 2011.
However, in an unusual move, Google had warned Wall Street on Friday that they hadn’t properly accounted for Google’s recent sale of its Motorola set-top box division, which could skew those estimates. Google Chief Accountant Brent Callinicos said that analysts had been including results for Motorola Home in their profit and sales estimates for 2012, but those figures would be pulled out of the overall figures, and accounted for as “discontinued operations.”
“That means our net income for this quarter as well as for Q2 ’12 and Q3 ’12 will be split between our ongoing operations and the Home business,” Callinicos said at the time.
Google had sold Motorola Home, the broadband unit of Motorola Mobility, to Arris in December for $2.35 billion ($2.05 billion in cash and approximately $300 million in newly issued Arris shares). Google had acquired Motorola Home as part of its $12.5 billion purchase of Motorola Mobility last year.
As of today, few Wall Street analysts had adjusted their estimates in response to Google’s note, with a notable exception being JP Morgan’s Doug Anmuth who lowered his numbers to $11.4 billion in revenue and $10.19 in EPS for the December quarter (vs. the Street average of $12.3 billion in revenue and EPS of $10.54).
The confusion around earnings sent Google’s stock down on Tuesday, the Wall St. Journal reported earlier this afternoon. The paper noted that Google has a history of volatile trading following its earnings reports, with Google stock averaging a 2.7 percent gain when it beats, and an average 7.9 percent decline when it misses.
Google was very explicit in its press release to explain the Motorola situation again, for those who didn’t get the memo the first time around. “Consolidated revenues would have been $15.24 billion had Motorola Home been included,” the report noted at the very top.
“We ended 2012 with a strong quarter,” said Larry Page, CEO of Google. “Revenues were up 36% year-on-year, and 8% quarter-on-quarter. And we hit $50 billion in revenues for the first time last year – not a bad achievement in just a decade and a half. In today’s multi-screen world we face tremendous opportunities as a technology company focused on user benefit. It’s an incredibly exciting time to be at Google.”
Given the analyst confusion over Google’s numbers, looking at Google’s key business figures was needed to get a grip on its earnings news today. Specifically, Google’s traffic acquisition costs increased in Q4 to $3.08 billion in the fourth quarter of 2012, compared to $2.45 billion in the fourth quarter of 2011, bringing Google revenue to $11.34 billion (minus these costs).
Paid clicks, which include clicks related to ads served on Google sites and the sites of its network members, increased approximately 24 percent over Q4 2011 and increased approximately 9 percent over Q3 of 2012. Meanwhile, average cost-per-click, which includes clicks related to ads served on Google sites and the sites of Google’s Network members, decreased approximately 6 percent over the fourth quarter of 2011 and increased approximately 2 percent over the third quarter of 2012.
Google’s net income in the fourth quarter was $2.89 billion ($8.62 per share), compared to $2.71 billion in the fourth quarter of 2011 ($8.22 per share).
Details and additional analysis from the earnings call to follow.
Full release below:
Google Inc. reported consolidated revenues of $14.42 billion for the quarter ended December 31, 2012. Consolidated revenues would have been $15.24 billion had Motorola Home been included.
MOUNTAIN VIEW, Calif. – January 22, 2013 – Google Inc. (NASDAQ: GOOG) today announced financial results for the quarter and the fiscal year ended December 31, 2012.
“We ended 2012 with a strong quarter,” said Larry Page, CEO of Google. “Revenues were up 36% year-on-year, and 8% quarter-on-quarter. And we hit $50 billion in revenues for the first time last year – not a bad achievement in just a decade and a half. In today’s multi-screen world we face tremendous opportunities as a technology company focused on user benefit. It’s an incredibly exciting time to be at Google.”
Q4 Financial Summary
In December 2012, we entered into an agreement with Arris Group, Inc. and certain other persons to dispose the Motorola Home business for a total consideration of approximately $2.35 billion in cash and stock, subject to certain adjustments. The transaction is expected to close in 2013. As a result, financial results related to the Home business are presented as net loss from discontinued operations on the consolidated statements of income, and are excluded from all other results unless otherwise noted. Assets and liabilities of the Home business are not presented separately because they are not material.
Google Inc. reported consolidated revenues of $14.42 billion for the quarter ended December 31, 2012, an increase of 36% compared to the fourth quarter of 2011. Google Inc. reports advertising revenues, consistent with GAAP, on a gross basis without deducting traffic acquisition costs (TAC). In the fourth quarter of 2012, TAC totaled $3.08 billion, or 25% of advertising revenues.
Operating income, operating margin, net income, and earnings per share (EPS) are reported on a GAAP and non-GAAP basis. The non-GAAP measures, as well as free cash flow, an alternative non-GAAP measure of liquidity, are described below and are reconciled to the corresponding GAAP measures at the end of this release.
GAAP operating income in the fourth quarter of 2012 was $3.39 billion, or 24% of revenues. This compares to GAAP operating income of $3.51 billion, or 33% of revenues, in the fourth quarter of 2011. Non-GAAP operating income in the fourth quarter of 2012 was $4.27 billion, or 30% of revenues. This compares to non-GAAP operating income of $4.04 billion, or 38% of revenues, in the fourth quarter of 2011. Had we included Home, non-GAAP operating income in the fourth quarter of 2012 would have been $4.31 billion.
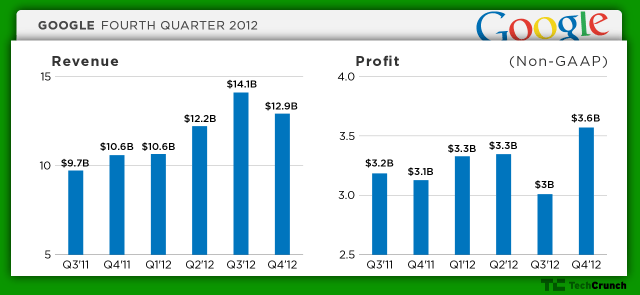
GAAP net income including net loss from discontinued operations in the fourth quarter of 2012 was $2.89 billion, compared to $2.71 billion in the fourth quarter of 2011. Non-GAAP net income in the fourth quarter of 2012 was $3.57 billion, compared to $3.13 billion in the fourth quarter of 2011.
GAAP EPS including impact from net loss from discontinued operations in the fourth quarter of 2012 was $8.62 on 335 million diluted shares outstanding, compared to $8.22 in the fourth quarter of 2011 on 329 million diluted shares outstanding. Non-GAAP EPS in the fourth quarter of 2012 was $10.65, compared to $9.50 in the fourth quarter of 2011.
Non-GAAP operating income and non-GAAP operating margin exclude stock-based compensation (SBC) expense, as well as restructuring and related charges recorded in our Motorola Mobile business. Non-GAAP net income and non-GAAP EPS exclude the expenses noted above, net of the related tax benefits, as well as net loss from discontinued operations. In the fourth quarter of 2012, the expense related to SBC and the related tax benefits were $700 million and $152 million compared to $536 million and $114 million in the fourth quarter of 2011. In the fourth quarter of 2012, restructuring and related charges recorded in our Motorola Mobile business were $178 million, and the related tax benefits were $65 million. In addition, net loss from discontinued operations, in the fourth quarter of 2012, was $21 million. In the fourth quarter of 2012, non-GAAP operating income with Home included the impact from Home of $35 million and excludes the above SBC expense and restructuring and related charges.
Q4 Financial Highlights
Revenues and other information – On a consolidated basis, Google Inc. revenues for the quarter ended December 31, 2012 was $14.42 billion, an increase of 36% compared to the fourth quarter of 2011.
Google Revenues (advertising and other) – Google revenues were $12.91 billion, or 89% of consolidated revenues, in the fourth quarter of 2012, representing a 22% increase over fourth quarter 2011 revenues of $10.58 billion.
Google Sites Revenues – Google-owned sites generated revenues of $8.64 billion, or 67% of total Google revenues, in the fourth quarter of 2012. This represents a 18% increase over fourth quarter 2011 Google sites revenues of $7.29 billion.
Google Network Revenues – Google’s partner sites generated revenues of $3.44 billion, or 27% of total Google revenues, in the fourth quarter of 2012. This represents a 19% increase from fourth quarter 2011 Google network revenues of $2.88 billion.
Other Revenues – Other revenues from Google were $829 million, or 6% of total Google revenues, in the fourth quarter of 2012. This represents a 102% increase over fourth quarter 2011 other revenues of $410 million.
Google International Revenues – Google revenues from outside of the United States totaled $6.9 billion, representing 54% of total Google revenues in the fourth quarter of 2012, compared to 53% in the third quarter of 2012 and 53% in the fourth quarter of 2011.
Foreign Exchange Impact on Google Revenues – Excluding gains related to our foreign exchange risk management program, had foreign exchange rates remained constant from the third quarter of 2012 through the fourth quarter of 2012, our Google revenues in the fourth quarter of 2012 would have been $130 million lower. Excluding gains related to our foreign exchange risk management program, had foreign exchange rates remained constant from the fourth quarter of 2011 through the fourth quarter of 2012, our Google revenues in the fourth quarter of 2012 would have been $193 million higher.
Google revenues from the United Kingdom totaled $1.30 billion, representing 10% of Google revenues in the fourth quarter of 2012, compared to 10% in the fourth quarter of 2011.
In the fourth quarter of 2012, we recognized a benefit of $37 million to Google revenues through our foreign exchange risk management program, compared to $25 million in the fourth quarter of 2011.
Reconciliations of our non-GAAP international revenues excluding the impact of foreign exchange and hedging to GAAP international revenues are included at the end of this release.
Paid Clicks – Aggregate paid clicks, which include clicks related to ads served on Google sites and the sites of our Network members, increased approximately 24% over the fourth quarter of 2011 and increased approximately 9% over the third quarter of 2012.
Cost-Per-Click – Average cost-per-click, which includes clicks related to ads served on Google sites and the sites of our Network members, decreased approximately 6% over the fourth quarter of 2011 and increased approximately 2% over the third quarter of 2012.
TAC – Traffic acquisition costs, the portion of revenues shared with Google’s partners, increased to $3.08 billion in the fourth quarter of 2012, compared to $2.45 billion in the fourth quarter of 2011. TAC as a percentage of advertising revenues was 25% in the fourth quarter of 2012, compared to 24% in the fourth quarter of 2011.
The majority of TAC is related to amounts ultimately paid to our Network members, which totaled $2.44 billion in the fourth quarter of 2012. TAC also includes amounts ultimately paid to certain distribution partners and others who direct traffic to our website, which totaled $634 million in the fourth quarter of 2012.
Motorola Mobile Revenues (hardware and other) – Motorola Mobile revenues were $1.51 billion, or 11% of consolidated revenues in the fourth quarter of 2012.
Other Cost of Revenues – Other cost of revenues, which is comprised primarily of data center operational expenses, amortization of intangible assets, content acquisition costs, credit card processing charges, and manufacturing and inventory-related costs, increased to $3.14 billion, or 22% of revenues, in the fourth quarter of 2012, compared to $1.25 billion, or 12% of revenues, in the fourth quarter of 2011.
Operating Expenses – Operating expenses, other than cost of revenues, were $4.81 billion in the fourth quarter of 2012, or 33% of revenues, compared to $3.38 billion in the fourth quarter of 2011, or 32% of revenues.
Amortization Expenses – Amortization expenses of acquisition-related intangible assets were $289 million for the fourth quarter of 2012. Of the $289 million, $153 million was as a result of the acquisition of Motorola, of which $116 million was allocated to Google and $37 million was allocated to Motorola Mobile.
Stock-Based Compensation (SBC) – In the fourth quarter of 2012, the total charge related to SBC was $708 million, compared to $536 million in the fourth quarter of 2011.
We currently estimate SBC charges for grants to employees prior to January 1, 2013 to be approximately $2.5 billion for 2013. This estimate does not include expenses to be recognized related to employee stock awards that are granted after December 31, 2012 or non-employee stock awards that have been or may be granted.
Operating Income – On a consolidated basis, GAAP operating income in the fourth quarter of 2012 was $3.39 billion, or 24% of revenues. This compares to GAAP operating income of $3.51 billion, or 33% of revenues, in the fourth quarter of 2011. Non-GAAP operating income in the fourth quarter of 2012 was $4.27 billion, or 30% of revenues. This compares to non-GAAP operating income of $4.04 billion, or 38% of revenues, in the fourth quarter of 2011.
Google Operating Income – GAAP operating income for Google was $3.75 billion, or 29% of Google revenues, in the fourth quarter of 2012. This compares to GAAP operating income of $3.51 billion, or 33% of Google revenues, in the fourth quarter of 2011. Non-GAAP operating income in the fourth quarter of 2012 was $4.42 billion, or 34% of Google revenues. This compares to non-GAAP operating income of $4.04 billion in the fourth quarter of 2011, or 38% of Google revenues.
Motorola Mobile Operating Loss – GAAP operating loss for Motorola Mobile was $353 million, or -23% of Motorola Mobile revenues in the fourth quarter of 2012. Non-GAAP operating loss for Motorola Mobile in the fourth quarter of 2012 was $152 million, or -10% of Motorola Mobile revenues.
Interest and Other Income, Net – Interest and other income, net, was $152 million in the fourth quarter of 2012, compared to an expense of $18 million in the fourth quarter of 2011.
Income Taxes – Our effective tax rate was 18% for the fourth quarter of 2012.
Net Income – GAAP net income in the fourth quarter of 2012 was $2.89 billion, compared to $2.71 billion in the fourth quarter of 2011. Non-GAAP net income was $3.57 billion in the fourth quarter of 2012, compared to $3.13 billion in the fourth quarter of 2011. GAAP EPS in the fourth quarter of 2012 was $8.62 on 335 million diluted shares outstanding, compared to $8.22 in the fourth quarter of 2011 on 329 million diluted shares outstanding. Non-GAAP EPS in the fourth quarter of 2012 was $10.65, compared to $9.50 in the fourth quarter of 2011.
Cash Flow and Capital Expenditures (including Home) – Net cash provided by operating activities in the fourth quarter of 2012 totaled $4.67 billion, compared to $3.92 billion in the fourth quarter of 2011. In the fourth quarter of 2012, capital expenditures were $1.02 billion, the majority of which was for production equipment, data center construction and facilities-related purchases. Free cash flow, an alternative non-GAAP measure of liquidity, is defined as net cash provided by operating activities less capital expenditures. In the fourth quarter of 2012, free cash flow was $3.65 billion.
We expect to continue to make significant capital expenditures.
A reconciliation of free cash flow to net cash provided by operating activities, the GAAP measure of liquidity, is included at the end of this release.
Cash – As of December 31, 2012, cash, cash equivalents, and marketable securities were $48.1 billion.
Headcount – On a worldwide basis, we employed 53,861 full-time employees (37,544 in Google and 11,113 in Motorola Mobile and 5,204 in Motorola Home) as of December 31, 2012, compared to 53,546 full-time employees as of September 30, 2012.