Android, by most accounts, is proving to be the most popular smartphone platform when it comes to devices getting sold today — partly due to the sheer variety of devices and price points that are out there. But a new research tool that tracks usage in real-time shows that when it comes to usage, consumers, in the U.S. at least, are far more active on Apple’s devices than on any other.
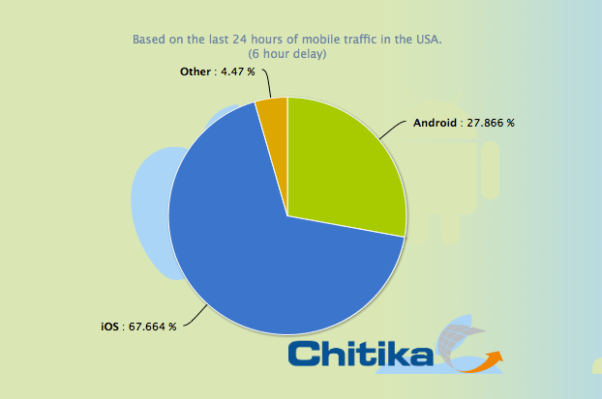
The numbers come from the ad network Chitika, which notes that in the last 24 hours, iOS devices, covering the iPhone, iPad and iPod models, accounted for just under 68 percent of all usage on its network. Android, meanwhile, accounted for just under 28 percent. Other platforms (Windows Phone, BlackBerry, etc.) were less than five percent of all activity. But there have been periods in the last few days when Android accounted for as little as 19 percent of traffic (on April 19, as it happens).
You can watch the new tool in action right here.
Chitika also breaks out what kind of iOS traffic we are talking about, and it looks like iPad tablet users are sending more traffic to its network — and browsing web sites and apps where Chitika’s ads appear — than iPhone users, with iPod traffic being the smallest of all.

If you look at the graphic on the site itself, you can run the cursor over the line chart to get specific percentages.
The stickiness of iOS and the iPad are also borne out by a separate piece of research from Chitika, which found that users of iPad tablets had the highest click-through rates. Looking at “hundreds of millions” of mobile ad impressions on its network, covering April 9-15, Chitika found iOS devices had a 0.72 percent CTR, and Android had a 0.60 percent CTR.
Within iOS, iPad users had the highest CTRs at 0.80 percent, compared to 0.67 percent for iPhone and iPod had 0.62 percent.
For the real-time research, Chitika explains that the numbers come from monitoring unique impressions on mobile devices covered by the Chitika Ad Network. It says it works in a six-hour delay into the numbers for “maximum continuity of data.”
Does this sound like mobile stat watching gone too far? For the majority it may well be — but this is actually a pretty interesting bit of data for the world of mobile advertising and mobile content in general. It potentially gives ad networks, and advertisers, a lot more insight into planning campaigns on platform versus another and one device compared to another. Publishers can use this kind of data to help decide how it channels resources for serving content to different apps and platforms and devices as well.
I think that we are bound to see some kind of response from the Google camp on these usage numbers, which do not put Android into the best light. It will also be worth watching to see if other ad networks follow suit and offer similarly granular insight into daily/hourly usage.
Update: In the original post I didn’t really go into the “why” behind the numbers because I was focusing on the actual real-time results — but in response to some of the comments below, here is some further detail on that end. As these numbers are based on Chitika’s own network traffic of hundreds of millions of impressions, they are not necessarily a picture of “all” of mobile internet usage. Others below also refer to data consumption varying between iOS and Android. That may be the case but this is not about how much data is used; but traffic from ad impressions. Another person makes the point that Android devices are often bought as cheap “feature” phones and not used as much for their web capabilities. That could be another reason why Android seems to generate less traffic than you would think compared to overall market share.
Lastly, some numbers from July 2011, also from Chitika, seem to indicate that iOS’s traffic share have slightly grown. Those numbers gave iOS a 60 percent share, compared to Android’s 36.3 percent. “Others” have also grown a little since then (it was 3.3 percent in July; now it’s about 4.5 percent).