App search company Xyologic is today releasing a total of 220 app download reports, featuring detailed data on Android, iOS and Windows Phone trends across 29 countries worldwide. The reports track statistics like the number of downloads per platform/per country, growth rates, country rankings, number of paid vs. free apps published, app revenue and details regarding app publishers’ individual rankings.
Unlike app store rankings, Xyologic’s reports use raw download numbers to rank apps, as opposed to complex algorithms often meant to boost app discoverability. Ranking by downloads per month also means that some of the most popular apps will be lower on the list because the majority of their install base already has the app on their phones. That’s why Facebook clocks in as the #18 free app on iPhone in the U.S., for example, while game maker Zynga comes in at #15.
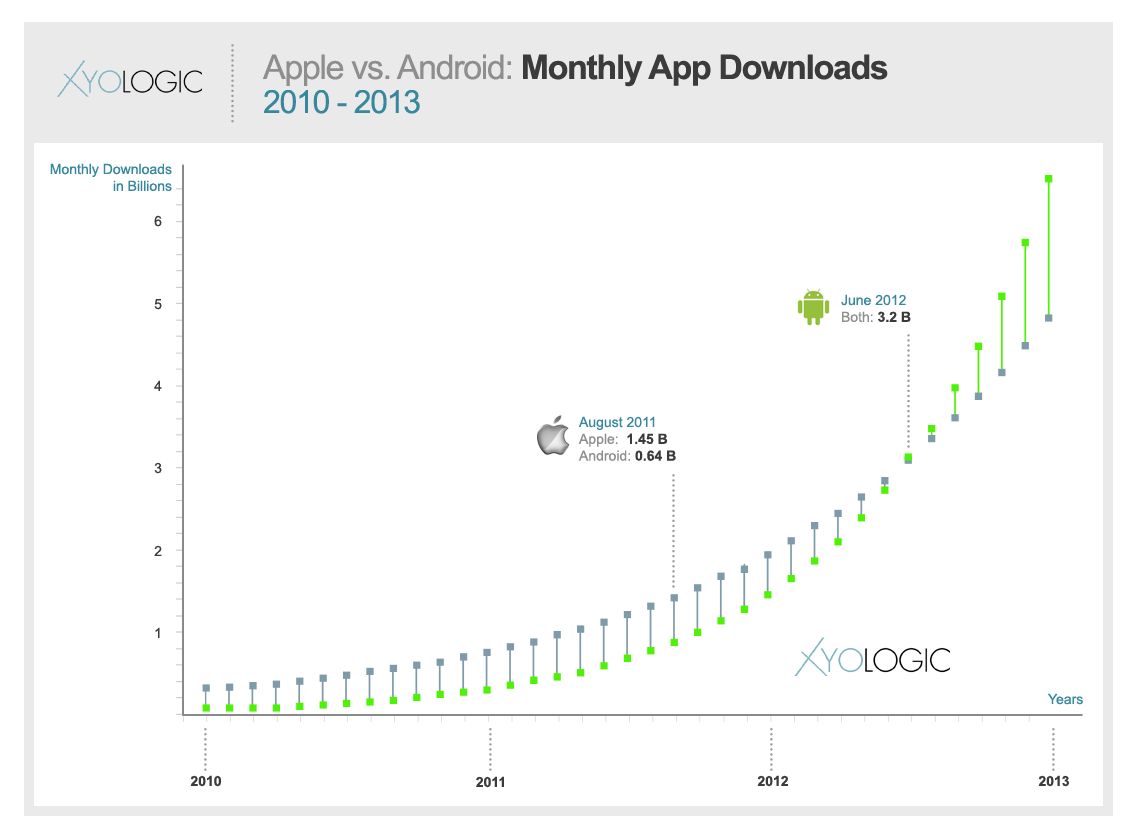
As an example of some of the trends these reports can help spot, Xyologic doled out some interesting tidbits of information, like how Apple saw 1.45 billion app downloads globally in the month of August versus 0.64 billion app downloads on Android. If Android’s current growth rate continues, it’s on track to catch up with Apple in June 2012, says Xyologic, at which point each platform will reach 3.2 billion downloads. (See chart).
In select countries, Android is already beating iOS in monthly app downloads, including in the Czech Republic, Poland and Portugal. However, the mobile market in these countries is not fully developed.
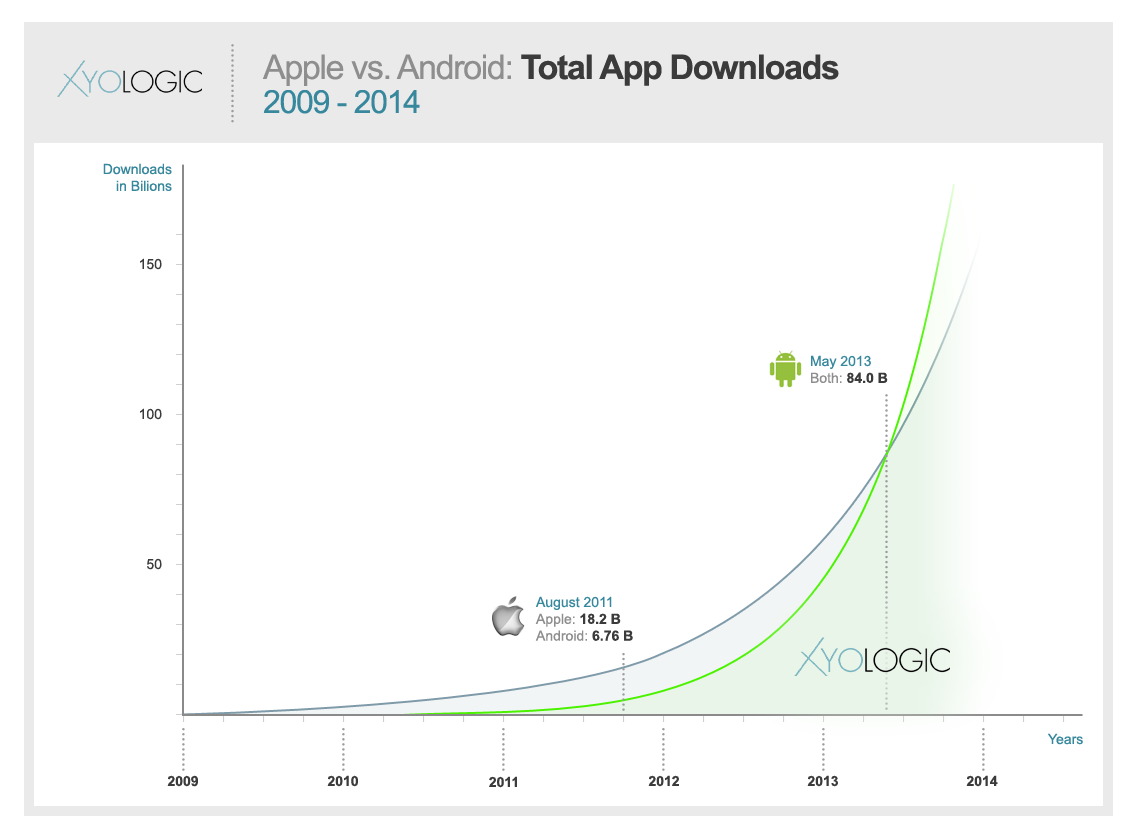
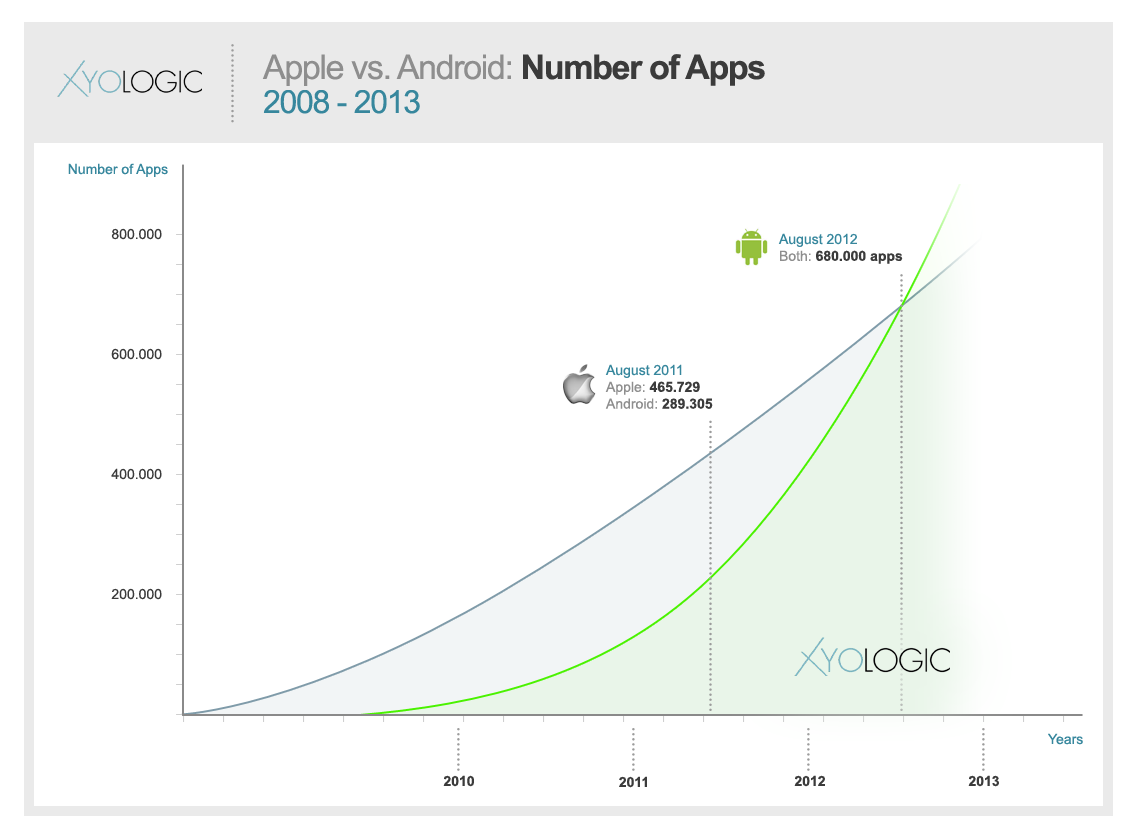
Xyologic also forecasts that Android will catch up to iOS in terms of total app downloads by May 2013 and number of apps by August 2012, if current trends continue. (See below charts).
Digging into the reports for the U.S., you can find details as to the top 100 app publishers per platform, including number of apps (free and paid), downloads per month (free and paid) and estimated revenue. Reports are broken down into categories, with separate reports for top apps, new apps and an in-app purchase economy report. These are provided for each platform (iPhone, iPad, Android and Windows Phone) where available, for 29 countries.
Frankly, there’s a lot of data to digest here, so much that even Xyologic claims that it expects its partners and community to discover even more than it could on its own. That, in part, is why the company decided to make these app reports available for free and will continue to do so on a monthly basis. Yes, 220 reports, 4 platforms, every month, for free. Not bad.
If you work in the mobile industry, this treasure trove of reports is definitely worth a look. You can access them all from here.


