
There is an estimated 3 million software engineers in Europe, depending on what report you want to believe, but finding the right engineers for the job at hand isn’t all that straightforward. London or Paris might well have the highest concentration of software engineers, but knowing what locales offer the best access to specific disciplines is an entirely different ballgame, particularly in such a geographically distributed continent as Europe.
This is something that venture capital (VC) juggernaut Sequoia is seeking to address with a new online interactive tool called Atlas, which, while built primarily with its own portfolio founders in mind, it’s releasing to the general public today too.
Atlas meshes various qualitative and quantitative data collection methods, including a talent survey of 1,035 participants; a survey of 125 recruiters from European tech companies; 17 “in-depth” interviews with founders and recruiters; and aggregated data from third-party sources such as Dealroom, SeekOut, Remote, Ledgy, and GitHub. At its core, Atlas attempts to present a picture of the current European technical talent landscape, incorporating the 27 members states of the European union plus Iceland, Liechtenstein, and Norway (collectively known as the European Economic Area [EEA]), in addition to Switzerland, Ukraine, and the U.K.
Talent density spikes
London comes out on top both overall (i.e., “all disciplines”) and in each individual discipline (e.g., AI, DevOps, security) in terms of volume of engineers. However, Atlas comes at this from the perspective that cities with the highest talent volume aren’t necessarily the best place to go looking for specific skills. As such, Atlas shows the densest per capita (i.e., per the broader software engineering population) concentration for a given speciality among the local talent pool, highlighting two dozen cities across Europe and their respective density spikes in 14 specialization areas.
“So this is cities that are punching above their weight for a certain type of engineering specialism,” Sequoia’s European talent director, Zoe Jervier Hewitt, explained to TechCrunch in an interview.

Sequoia’s Atlas in action. Image Credits: Sequoia
For example, Atlas data suggests that Dublin’s general engineering quality across all specialities sits at just 37% in terms of the number of engineers with four- or five-star GitHub ratings. But when filtered down to engineers with an AI specialism, this figure jumps up to 60%. This positions the Irish capital as one of the hottest places for AI talent, along with several other key hubs across Europe, which tallies with separate reports from recent years that position Dublin as a top AI talent hub.
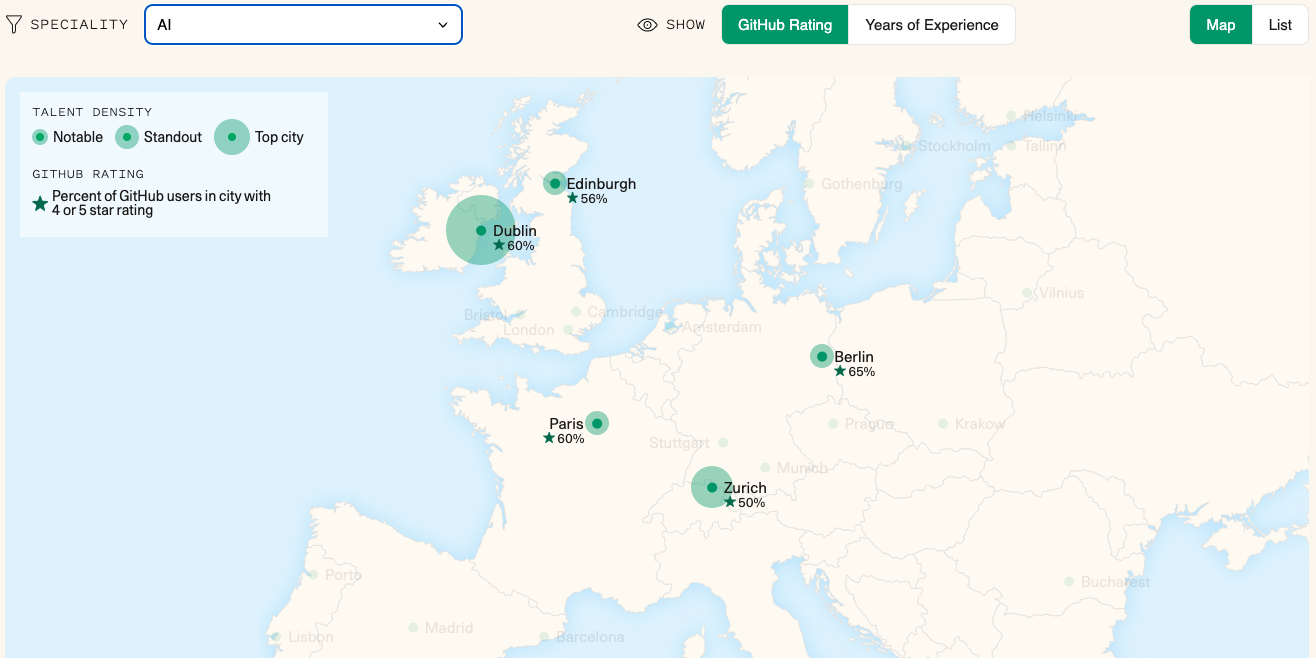
AI talent density on a per capita basis. Image Credits: Sequoia Atlas
A curious omission from Atlas is that while it gives a percentage of GitHub users in a city with four- or five-star ratings, it doesn’t do this at a top level for the overall talent density of skill-specific engineers in the city — regardless of their level of experience, what their GitHub rating is, or whether they even use GitHub at all.
Indeed, while the circles serve as useful visual indicators of the biggest outliers in talent density — the bigger the circle, the bigger the talent density — it’s impossible to know how they actually compare to each other. How much higher is Dublin’s AI talent density than Zurich, or Paris, or Berlin, or Edinburgh? It turns out this was a deliberate design decision, according to a Sequoia spokesperson, who said that percentages wouldn’t do a good enough job of conveying the contrast between the densities, whereas splitting them into broad “Notable,” “Standout” and “Top city” made it easier to parse the differences.
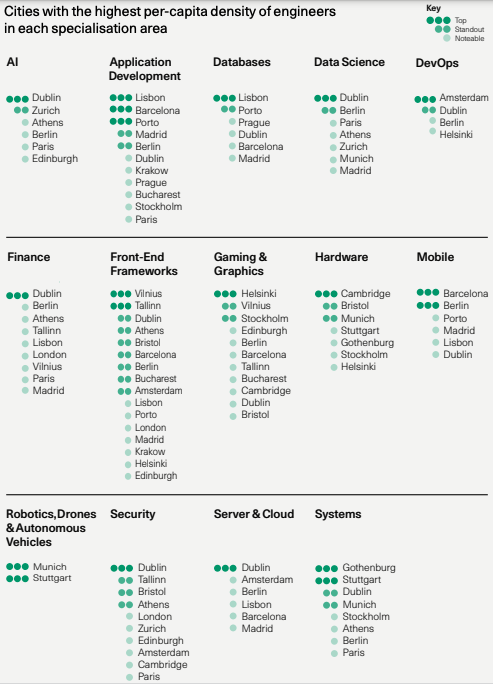
Speciality densities. Image Credits: Sequoia
Moreover, it’s also worth considering why a higher density of engineers with a particular talent in one location is more useful than another city with a lower density but higher overall number. The Sequoia spokesperson said that the correlation between specialization density and the quality of the engineers, as defined by their GitHub star ratings, is one reason why this matters — evidenced by the jump in four- and five-star GitHub ratings for Dublin when filtered by AI as their specialism.
“We see this pattern repeated across different specializations,” the spokesperson said. “[Also], outlier talent density in a particular city means a relative abundance of available talent for a specific skill set to recruit from. For instance, Amsterdam has the highest density of DevOps engineers, which means on a local basis it has the richest supply of DevOps talent. While London may have more DevOps engineers in total, they are in relatively short supply as a proportion of London’s overall talent pool, which may make recruiting them more difficult, particularly for early-stage startups competing against established tech giants.”
Other notable tidbits to emerge from the research provided in Atlas is that Germany (Stuttgart and Munich, specifically) is a hotbed for engineers focused on robotics, drones and autonomous vehicles, while Gothenburg in Sweden is something of an outlier for systems engineers.
Helsinki, meanwhile, is big for top gaming and graphics engineers.

Graphics and gaming. Image Credits: Sequoia
Of course, if a fledgling startup really is just looking for the high-volume hubs, they can use Atlas to pick out places that might not be instantly obvious, such as Madrid, which apparently has the highest number of engineers outside of London and Paris across all specialities.
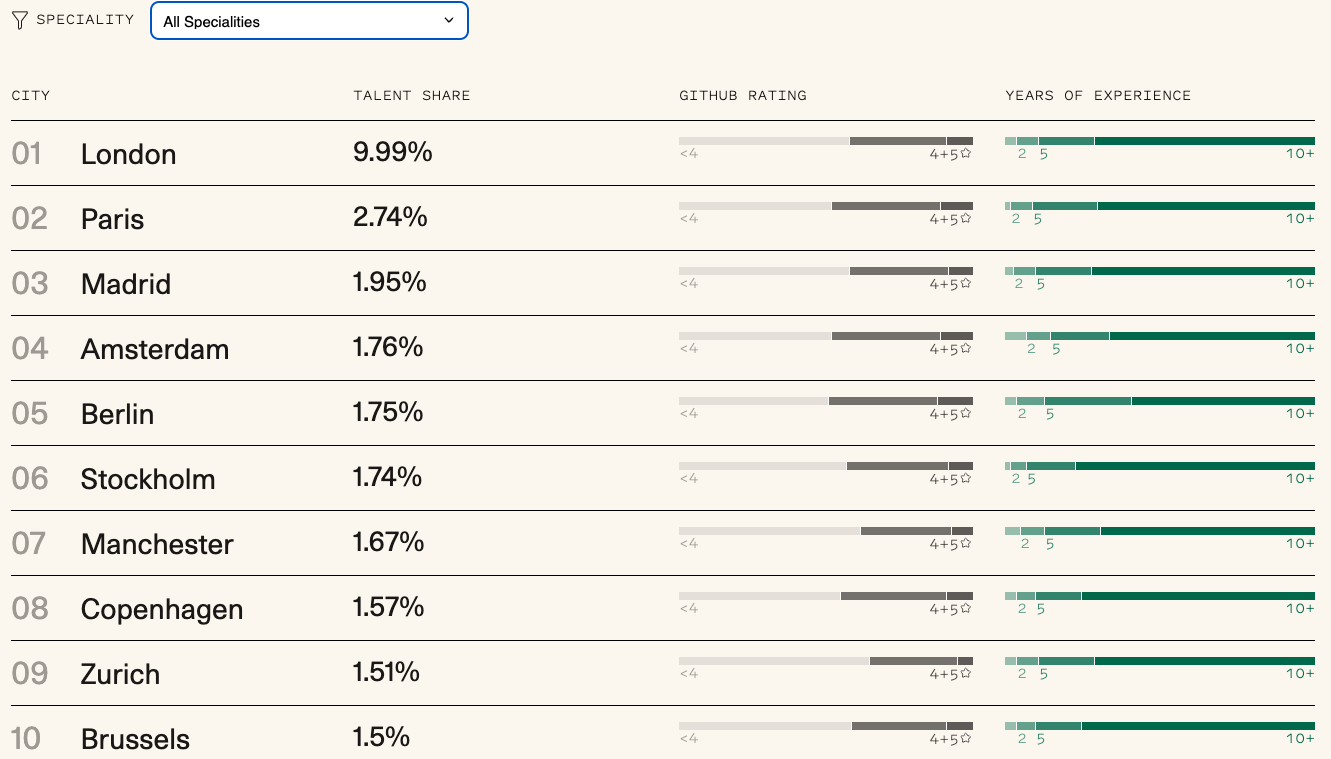
Engineering talent hot spots. Image Credits: Sequoia Atlas
Users can also drill down into specific hubs and see what the lay of the land is in terms of volume of engineers; primary and secondary skills; percentage of female engineers; number of accelerators; and the “tech ecosystem value.”
While these various data points may prove useful, Atlas perhaps could benefit from proper data sourcing. For instance, Lithuania’s capital Vilnius apparently has a “tech ecosystem value” of €9.3 billion, but without knowing where this figure was derived from, it’s difficult to know precisely what it means. In this instance, Sequoia did confirm to TechCrunch that this was garnered as part of its integration with tech data provider Dealroom, which defines the “ecosystem value” as such:
[The] sum of the valuations of all startups in the ecosystem. Using estimated valuations based on most recent VC rounds, public markets and publicly disclosed valuations.
However, it perhaps would be more useful if Atlas showed exactly where its various data points have come from, using little clickable on-screen icons.
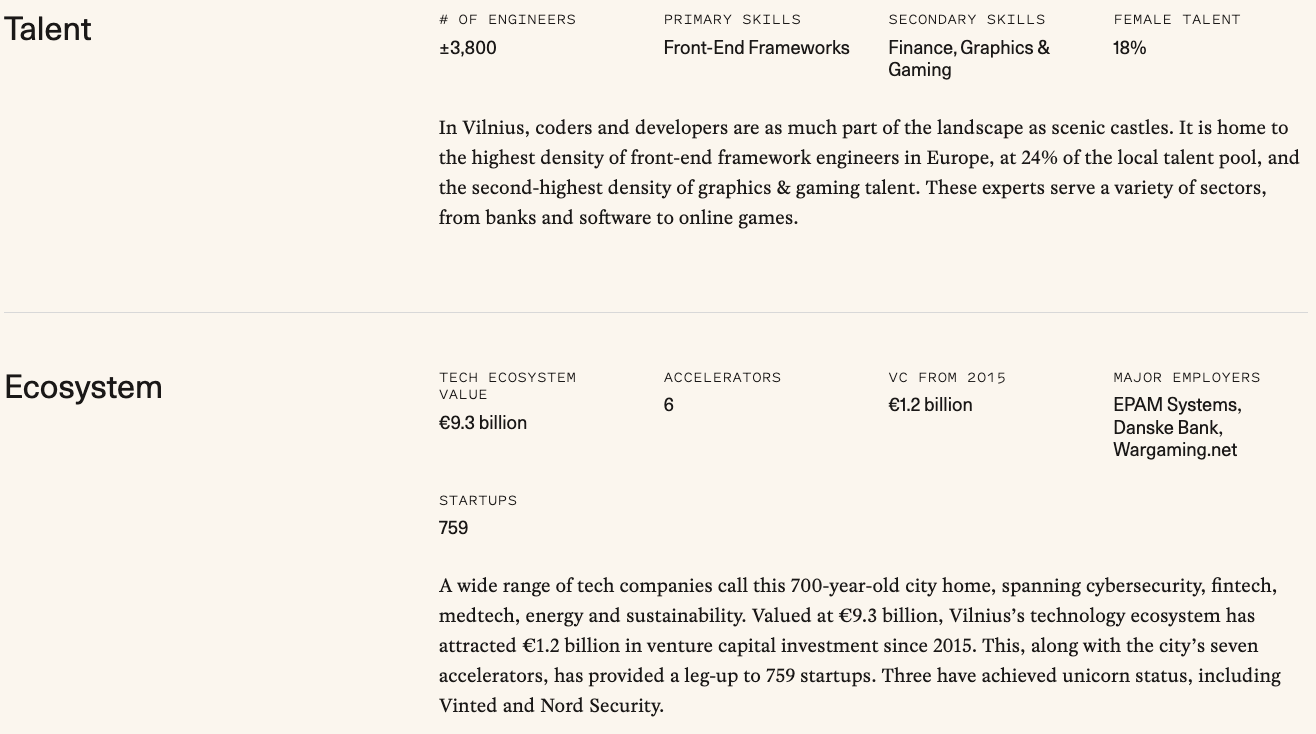
Sequoia’s Atlas: Vilnius. Image Credits: Sequoia
Use cases
While knowing where to find the best robotics or hardware or systems engineers is an important selling point of this tool, it could also be used by remote-first companies looking to set up satellite offices, for instance, or even base their entire HQ.
The founder of one of Sequoia’s portfolio companies, Robco — a German robotics startup that recently raised $14 million — apparently moved from Boston back to Munich because of its abundance of robotics talent. And this is the type of scenario that Hewitt reckons that startups, scale-ups, or even Big Tech recruiters might use Atlas for, which is particularly pertinent at a time when the remote-work trend is showing little sign of easing.
“I think founders can use Atlas as a lens for things like ‘where should we put our HQ‘ or ‘where should we put our main office,'” Hewitt said. “I think the other use case will be around how founders want to think about and evolve their philosophies around remote and hybrid work. I think it will help founders inform whether they choose to operate a fully remote engineering team or a hybrid. So we hope that it will be useful as many companies are trying to strike that balance of hybrid and in-person.”
A year in the making, Atlas is available for anyone to use today. But all this leaves us with at least one lingering question. According to Hewitt, they detected shifts in attitudes toward remote, hybrid, and office-based working during the course of developing Atlas, which leads us to wonder how useful this tool will be, say, a year or two from now as Europe’s diverse and distributed tech workforce continues to evolve.
Put simply, is the plan to make Atlas a living, breathing reflection of the European tech talent ecosystem?
“I think we want to see the response from founders,” Hewitt said. “I mean, we think it’s a really great tool, and I hope it’s going to create value for lots of hiring teams. Whether we will update it every year, I think we’ll wait to see what the initial reception is.”