
Hello and welcome back to our regular morning look at private companies, public markets and the gray space in between.
The crew at Bessemer released their new, yearly cloud report this week. It’s a useful lens into how venture capitalists are thinking about cloud and SaaS startup performance metrics. Bessemer’s cloud and SaaS exits include Twilio, Shopify, PagerDuty, Box, and a few others, so they’re worth listening to at least a little on the topic.
I bring all this up as I finally got the chance to read the 2020 report (here, if you want to dig through it yourself, and here’s the 2019 version for reference). I’m going to chat with Bessemer’s Mary D’Onofrio about some numbers from the presentation next week, but this morning I wanted to discuss the report’s SaaS and cloud startup scorecard.
Bessemer likes to invent metrics, something that I approve of. In 2019, the firm debuted a G.R.I.T (“ARR growth, retention, years of runway, and efficiency”) score that was a bit complicated. This year the report included a six metric rundown of “good, better, and best” startup cloud and SaaS startup performance.
Let’s chew over the set of SaaS metrics that investors, before COVID-19, were looking for. Next week we’ll find out if Bessemer has changed any of them in light of the new economic collapse cum malaise.
Grow this fast, lose this much
TechCrunch has a general rule against screenshots of text, but today there’s no way around it. Here’s the pertinent summary slide from the Bessemer report:
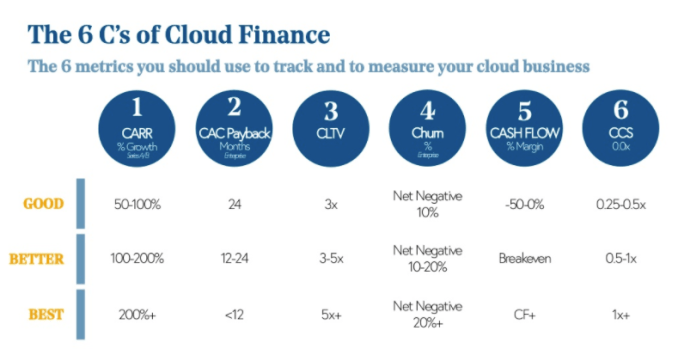
Now there’s nuance to a few of these figures. It often breaks down by customer cohort churn expectations are different for SaaS companies targeting small business versus enterprise-scale customers. That said, you can get a pretty good idea of what the venture class expects from modern software businesses from the chart. Let’s talk about each.
The first metric is committed annual recurring revenue (CARR), a metric similar to annual recurring revenue (ARR) but with the addition of “contracted but not live ARR” and the removal of projected churn. What’s that? If a customer on an annual license hasn’t formally churned, but also hasn’t used the product in 6 months, you probably know what’s going to happen. CARR wants to yank that top line from ARR, while allowing for newly sold contracts to show up a bit earlier than they otherwise might.
As CARR is a revenue metric, more of it is better than less. The later-stage a company is the slower it can expand CARR, but as you’ll note 100% or more growth is pretty much the expectation, regardless. How Bessemer’s expectations for this metric in particular have changed post-COVID-19, in particular, is something I’m going to find out.
CAC Payback is the amount of time (payback period) that it takes to recoup the cost of acquiring a customer (CAC). The less time the better, as it means that more customers will pay back their acquisition costs before churning, and thus generate margin for business to spend on other things. The math here is actually fun. The formula is last quarter’s sales and marketing costs, divided by quarterly net new MRR, discounted by the firm’s gross margin. That should kick out a margin-adjusted number of months it takes to generate enough post-COGS revenue to recoup CAC. Simple!
CLTV, or customer lifetime value, is also pretty grokkable. This is LTV/CAC, but set up a little differently from how I first learned the statistic. The method of calculation isn’t hugely important, but what does matter is that the old chestnut that SaaS companies want their customers to generate revenues of three times their CAC is not really right. Bessemer claims that customers should generate gross margin-adjusted revenues of five times their CAC to be really great — that’s a harder grading curve than I expected.
Churn is something we’ve spoken about a lot lately. Again, this is a set of metrics that I intend on asking about changes to in the new era, but inside the figures you see above there’s a wrinkle. As you anticipated, Bessemer expects that SaaS and cloud companies that target SMBs will see more churn than those targeting larger customers. But, in the “best” categories for SMB-focused SaaS companies, the venture firm only allows for net-negative churn — how many SaaS business targeting SMBs have net negative churn (positive dollar retention)? Again, this a higher bar than I would have anticipated.
The cash flow metrics are simple, even if I suspect that more SaaS startups fall under the “good” bar more than they would like to admit it before COVID-19.
Finally, there’s a startup’s cash conversion score (CCS). This isn’t hard to get. To calculate a startup’s CCS, take its CARR (committed annual recurring revenue) and divide it by the result of the firm’s total capital raised minus its cash on hand. The goal here is to find out how much cash the startup has burned to generate some amount of annual recurring revenue. Here are some examples I made up for you:
- If a company had $10 million in CARR, raised $15 million to get there, and still had $5 million in the bank, it would have a CCS of 1x. That’s “best.”
- A startup that raised $35 million to generate $22 million in ARR and had $3 million on hand would generate a CCS score of 0.57x, something that Bessemer would deem “better.”
- A startup that raised $60 million to generate $20 million in ARR and had $5 million of cash on hand would have a CCS score of 0.36x. That’s in the middle of “good.”
- If that same company had raised $10 million more ($70 million) and had $3 million less cash on hand ($2 million net), that would see its CCS score fall to 0.29x, which is still counts as “good.” This begs the question: How many SaaS companies are less fucking efficient than that? It must be many if our example company earns the moniker “good.”
Now we’re caught up. More when I talk to the firm about recession-era adjustments.