Consumers downloaded a record 204 billion apps in 2019, up 6% from 2018 and up 45% since 2016, and spent $120 billion on apps, subscriptions and other in-app spending in the past year. The average mobile user, meanwhile, is spending 3.7 hours per day using apps. This data and more comes from App Annie’s annual report, “State of Mobile,” which highlights the biggest app trends for the past year, and sets forecasts for the years ahead.
According to App Annie, the record growth in mobile downloads in 2019 can be attributed to the growth taking place in emerging markets like India, Brazil and Indonesia, which have seen downloads soar 190%, 40% and 70%, respectively, since 2016. Meanwhile, download growth in the U.S. has slowed to just 5% during that same time, while China saw 80% growth.
That doesn’t mean users in mature markets aren’t downloading apps, only that the growth in year-over-year download numbers is starting to level off. Still, these more mature markets continue to see large numbers of installs, with more than 12.3 billion downloads in the U.S. in 2019, 2.5 billion in Japan and 2 billion in South Korea.
The record numbers are notable also, given that App Annie’s analysis excludes re-installs and app updates.
App store consumer spending was on the rise in 2019, as well, with $120 billion spent on apps — a figure that’s up 2.1x from 2016. Games continue to account for the majority (72%) of that spending, but the shift toward subscriptions has played a role, too. Last year, subscriptions in non-gaming apps accounted for 28% of consumer spending, up from 18% in 2016.
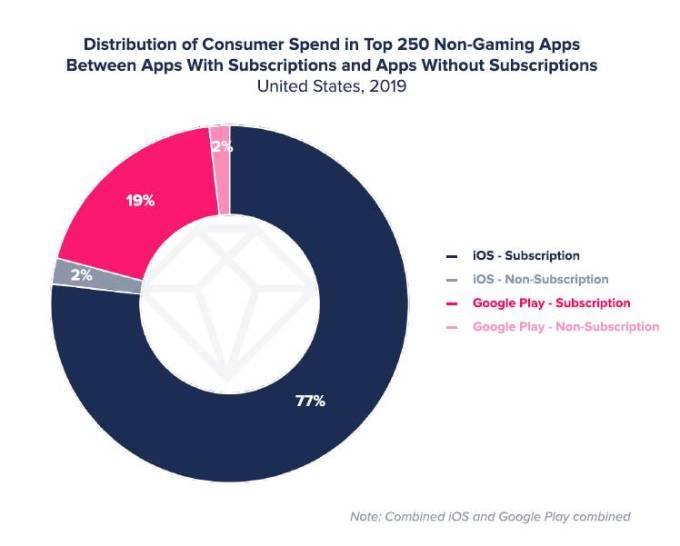
Subscriptions are now the primary way many non-gaming apps generate revenue. For example, 97% of consumer spending in the top 250 U.S. iOS apps was driven by subscriptions, and 94% of the apps used subscriptions. On Google Play, 91% of the consumer spending was subscription-based, while 79% of the top 250 apps used subscriptions.
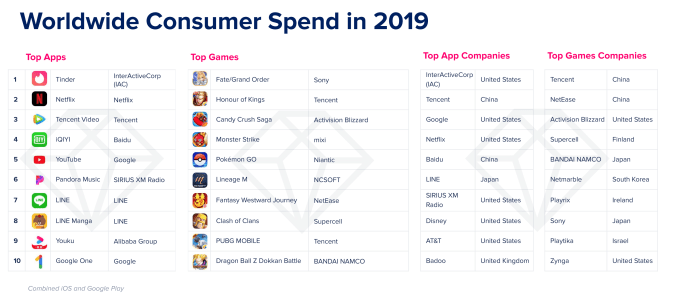
In particular, dating apps like Tinder and video apps like Netflix and Tencent Video topped 2019’s consumer spend charts, thanks to subscription revenue.
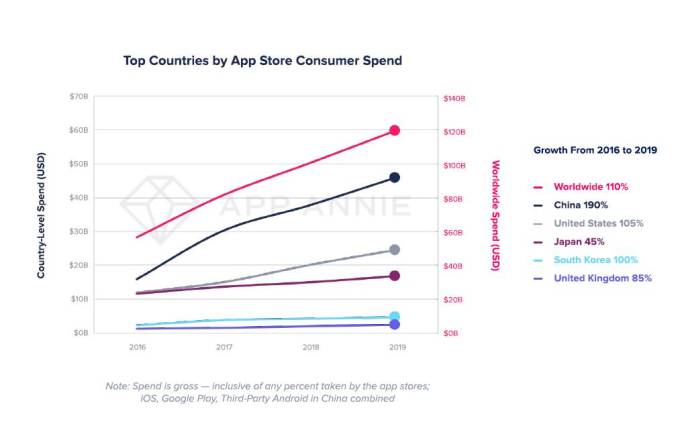
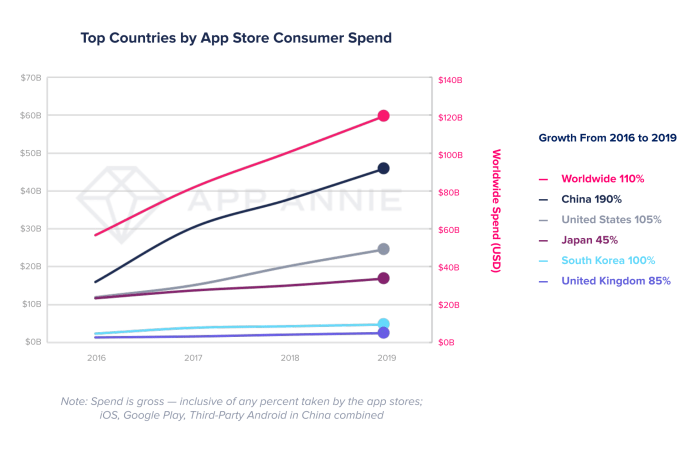
Mature markets, including the U.S., Japan, South Korea and the U.K. are helping to fuel consumer spending across both games and subscriptions, App Annie found. But China remains the largest market by far, accounting for 40% of global spend.
App Annie also forecast that the mobile industry will contribute $4.8 trillion to the global GDP by 2023.
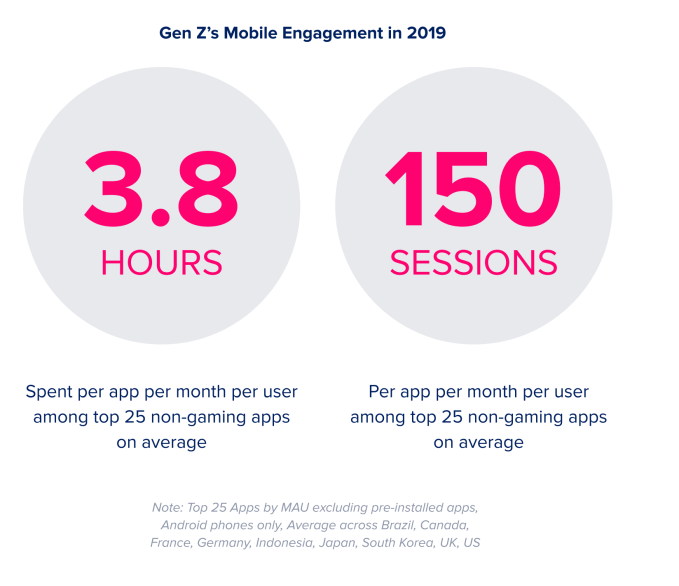
The report additionally identified several mobile trends from 2019, including the mobile app connection to the Internet of Things and smart home devices (106 million downloads for the top 20 IoT apps last year); the huge mobile engagement by Gen Z (3.8 hours per app per month, among the top 25 non-game apps, on avgerage); and mobile ad spend’s growth ($190 billion in 2019 to $240 billion in 2020).
Ad spending combined with consumer spending is expected to reach $380 billion worldwide by 2020, App Annie forecast.
Gaming was given a big breakout section, given its contribution to consumer spending.
Consumer spending in mobile gaming was 2.4x that of Mac/PC gaming, and 2.9x more than game consoles. In 2019, mobile gaming saw 25% more spending than all other gaming, and is on track to surpass $100 billion across all app stores by next year.

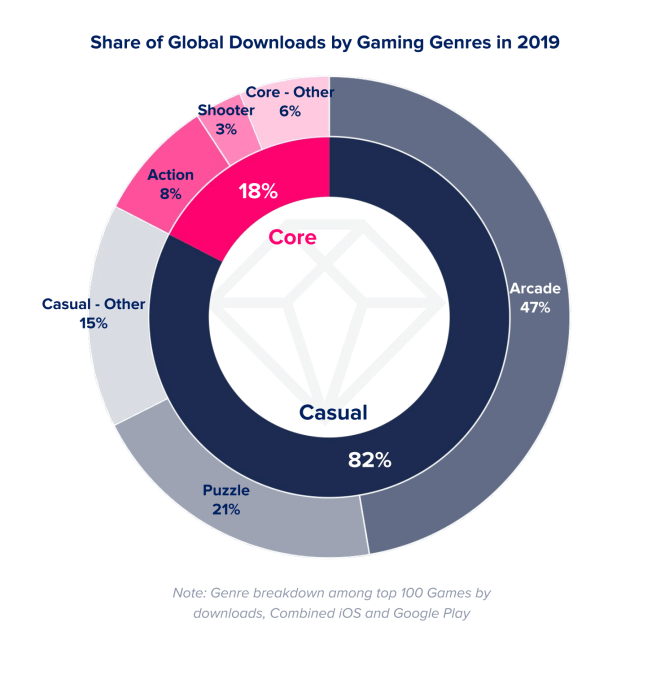
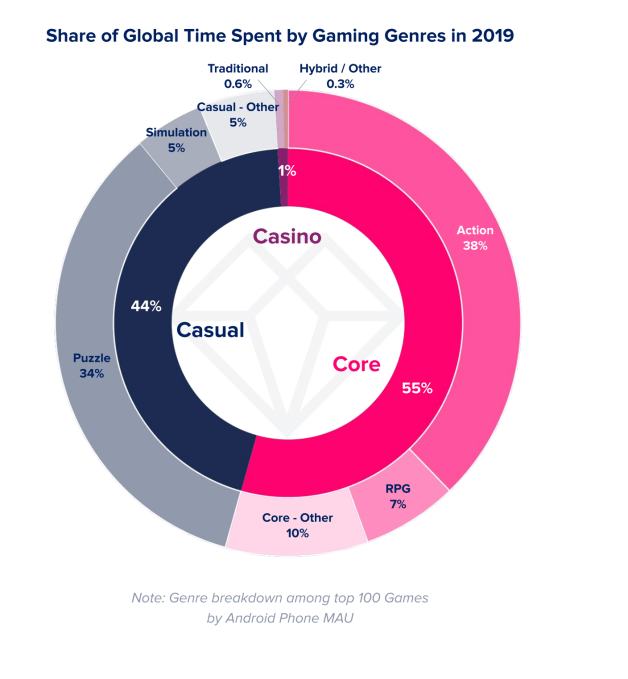
Casual gaming (led by Puzzle and Arcade) was the most downloaded type of games in 2019. Meanwhile, core games (e.g. Action, RPG, etc.) — which were only 18% of downloads — accounted for 55% of time spent in top games. PUBG Mobile was the No. 1 core game (action) on Android in 2019, in terms of time spent, while Anipop (puzzle) was the top casual game.
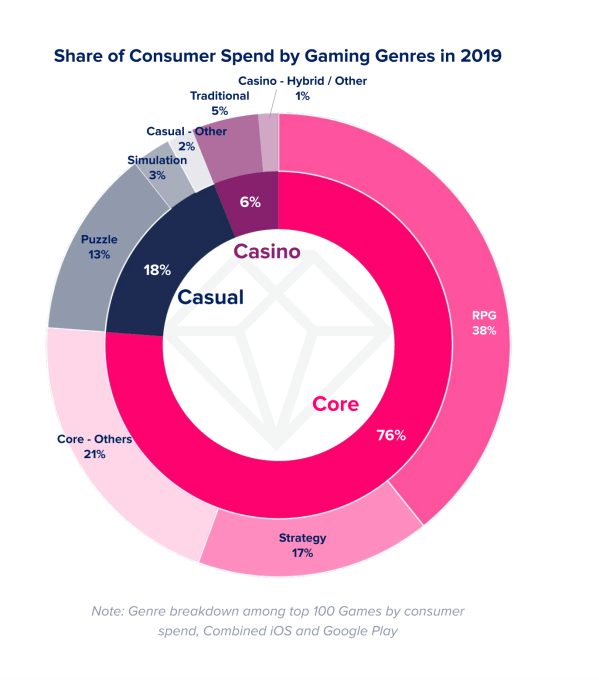
Core games also accounted for the majority (76%) of game spending, followed by casual (18%), then casino (6%).
In 2019, 17% more games surpassed $5 million in consumer spending versus 2017. And the number of games to top $100 million grew 59% compared to two years prior. Despite the sizable growth in revenues, App Annie also pointed to new models in mobile gaming, like Apple Arcade, which is giving other types of games a chance to thrive. Unfortunately, no third-party firm is able to track Arcade revenues, which will become a glaring blind spot for App Annie in the years ahead.
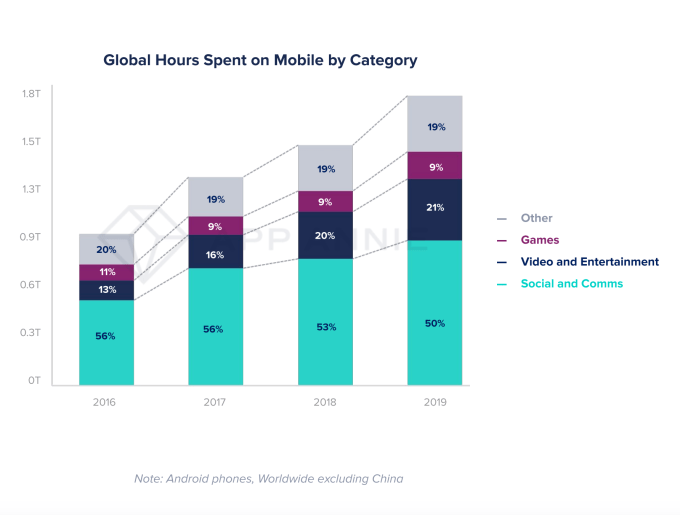
App Annie also examined other sizable segments of the mobile market for trends, including fintech, retail, streaming and social. Some of the more significant findings included: the fintech app user base growth topping that of traditional banking apps; shopping app downloads saw 20% year-over-year growth to reach 5.4 billion downloads; streaming growth that included 50% sessions in 2019 compared to 2017; and 50% of time spent on mobile was spent in social networking and communication apps.
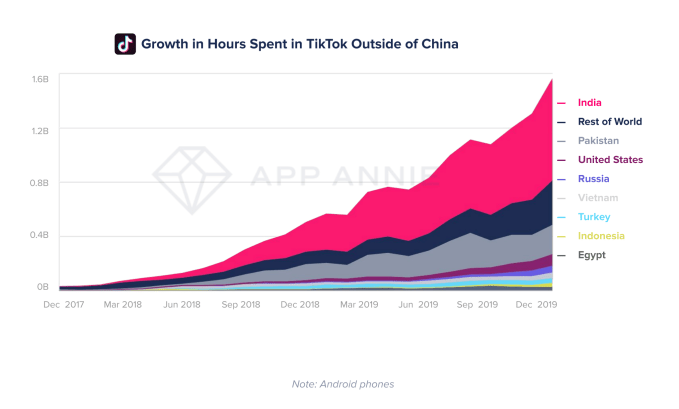
 TikTok was given special attention, given its rapid growth last year. Time spent in the short-form video app grew 210% year-over-year in 2019 globally. Even though eight out of every 10 minutes spent in TikTok were by users in China, the app’s usage skyrocketed in other markets as well, App Annie said.
Industries App Annie identified as being transformed by mobile in 2019 included ridesharing, fast food/food delivery, dating, sports streaming, plus health and fitness. The full report offers a few more details and mobile trends for each of these.
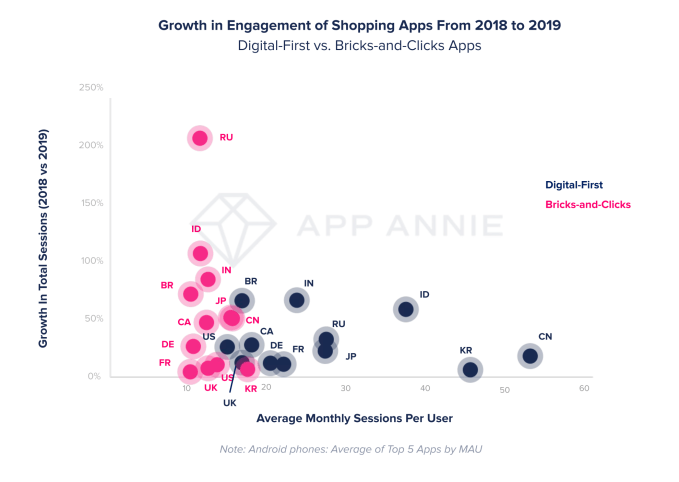
One bigger highlight was that digital-first shopping apps still had 3.2x more average monthly sessions per user compared with apps from traditional brick-and-mortar retailers (dubbed “bricks-and-clicks” apps in the report).
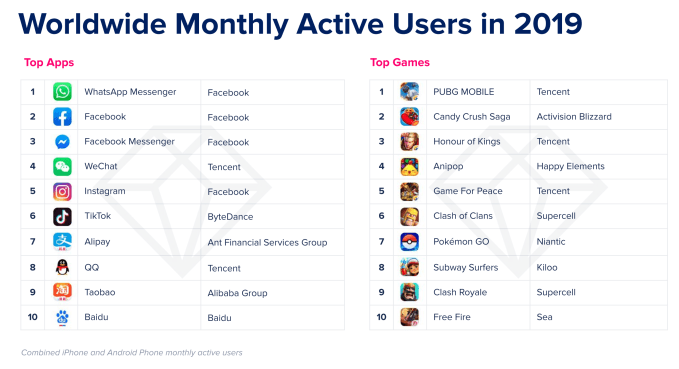
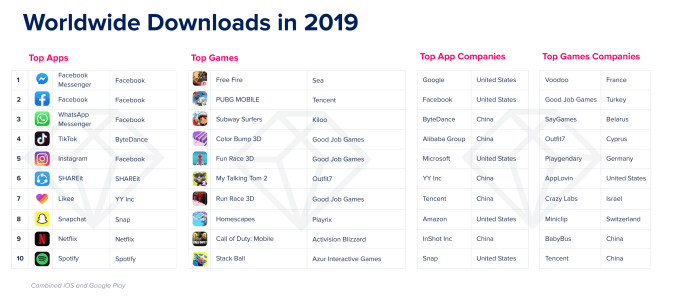
App Annie also compiled its own list of the top apps of 2019 by active users, downloads and revenue. Facebook apps still led by engagement, with WhatsApp, Facebook and Messenger in the top three spots and Instagram as No. 5. And they maintained similar positions by downloads, only swapping places with one another.
Consumer spending was a different story, with Tinder generating the most revenue in 2019, followed by entertainment and streaming apps like Netflix, Tencent Video, iQIYI, YouTube and others.