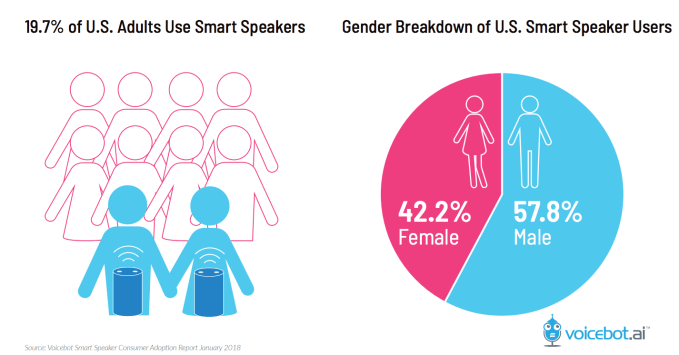
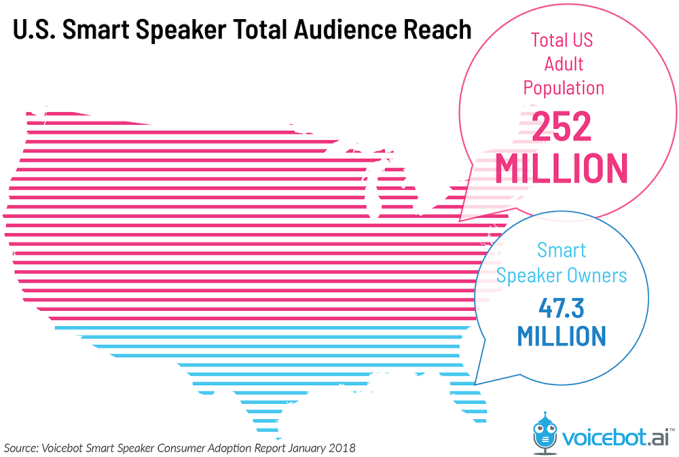
Nearly one in five U.S. adults today have access to a smart speaker, according to new research out this week from Voicebot.ai. That means adoption of these voice-powered devices has grown to 47.3 million U.S. adults in two years – or 20 percent of U.S. adult population.
To clarify, “access to a smart speaker” means the adults have one in their home, but they may not be a primary user. So, a spouse, a roommate, or a live-in partner would also qualify as a smart speaker user, according to this study.
That’s a difference worth pointing out, especially if making a comparison to other technology devices, like smartphones or wearables, which tend to have only one owner. It may be more accurate, then, to compare smart speaker adoption to other technologies.
For instance, it took 13 years for televisions to reach the 50 million mark, versus 2 for smart speakers. It took 4 years for internet access to reach 50 million, and 2 years for Facebook. Of course, none of these are an apples-to-apples comparison, especially considering the costs (or lack thereof) involved, and the increasingly rapid pace of technology adoption. Still, it’s fun to see where smart speakers slot in.
The report’s findings are based on a survey of 1,057 U.S. online adults in January 2018, but device ownership was adjusted downward to compensate for the fact that online adults are 88.5 percent of the U.S. population.
In addition to ownership, the survey also revealed the characteristics of smart speaker owners.
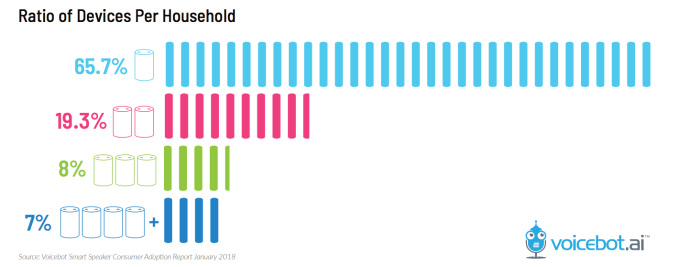
For instance, market reach is not currently uniform across genders – 57.8 percent of owners identify as male, while 42.2 percent are female. The majority (nearly two-thirds) only own one device. That’s something of an indication that users aren’t seeing a need to spread devices around the home (or perhaps the young generation’s migration to cities and their small apartments is playing a role here, too.)
For smart speaker manufacturers, like Amazon and Google, and more recently Apple, that also means it’s a bit of zero sum game. The device makers are battling to be the home’s smart speaker, because people aren’t often buying a second.
Beyond the 67.5 percent single-device owners, 19.3 percent own two smart speakers, and smaller percentages own three or four. This averages out to 1.8 devices per consumer. But given the current adoption, there are still plenty of potential new customers device makers can sell to for the time being.
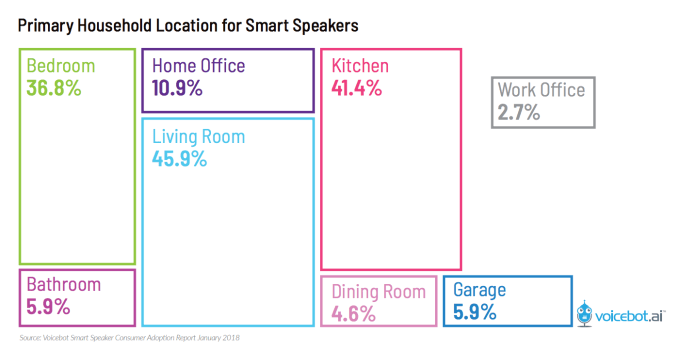
Consumers tend to use the smart speakers in either the living room (45.9% do) or kitchen (41.4%), followed by the bedroom (36.8%) and home office (10.9%).
For voice app developers, that means a focus on music and entertainment will sell better in the near-term, but it also paints a picture of future opportunity for those who build workplace apps – an area that hasn’t yet seen widespread adoption, but could be next – especially if Amazon has its way.
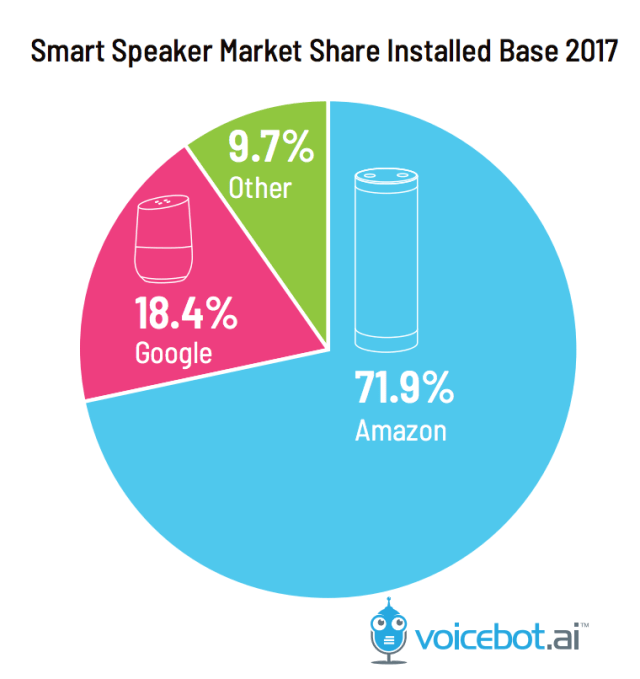
The report also reconfirms Amazon’s lead in the market, with 71.9 percent of the device install base compared with Google’s 18.4 percent, and the 9.7 percent of “other” devices (including Alexa- and Google Assistant-powered devices from other companies besides Amazon and Google, plus Cortana devices.)
However, keep in mind these are U.S. numbers. Similar to the iPhone/Android battle, Google has taken a lead in other countries around the world, including Canada, France, and Australia in 2017, and Amazon’s lead in the U.K. and Germany narrowed.
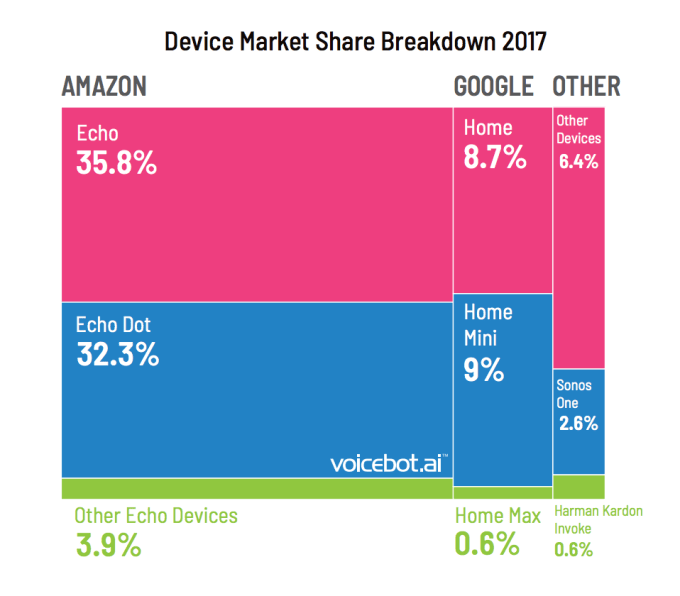
The Amazon Echo and Echo Dot command the market, with nearly two-thirds share, largely because they’ve been out longer. But newer sales indicate a preference for the smaller form factor and low-priced smart devices, like Echo Dot and Google Home Mini, the latter which outsold Google Home in three months’ time.
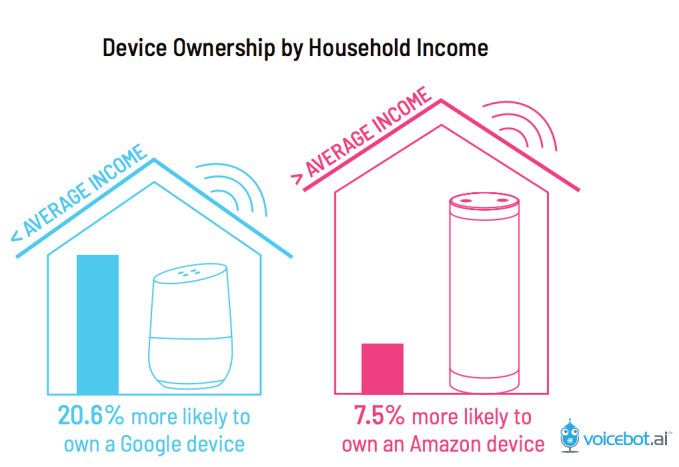
As to who chooses Amazon versus Google, homes with above-average income are 7.5 percent more likely to opt for an Echo, while those with income below the national average tend to own a Google smart speaker.
Speakers are also attractive to iPhone users, 22 percent who are more likely to own a speaker, and 30 percent less likely to buy one from Google.

Further details about use cases and voice commerce are in the full report, here.
Update: a mislabeled graphic with the U.S. population was removed from the original version of this post. The graphic reads “Total US population 252M;” this is the US adult population, and where the 20% figure comes from. But the graphic made that unclear. We asked for an updated version of the graphic, which has been provided. (2/7/18, 3:40 PM ET)