Chances are that your current company is collecting a ton of data about your customers every second. It’s a goldmine and it often sits there in a corner, unused. Vize is a business intelligence tool that will let you learn more about your business and take advantage of all your data. The company is currently participating in Y Combinator’s winter batch.
“The main use case for Vize is data analytics and data discovery,” co-founder and COO Noureddine Lakehal told me. “We let users do many different tasks without any coding skill — preparing, cleaning up, expanding, combining, visualizing, aggregating, calculating, modeling your data, or doing ‘what-if’ analysis with your data…”
So Vize isn’t directly competing with the most sophisticated business intelligence tools. It’s a visual tool that lets you get started with business intelligence. It’s all about visually exploring big datasets.
And Vize is also quite versatile when it comes to processing data. You can upload any static file, such as a CSV, XLS or JSON file. You can also directly connect Vize to your SQL database. The startup will add support for NoSQL databases soon.
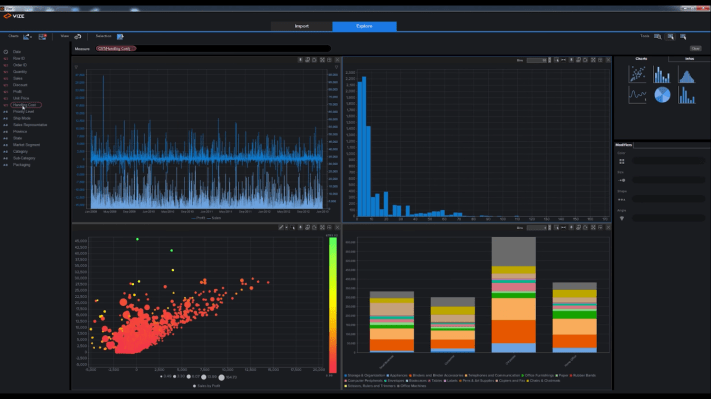
After connecting Vize to your data, the startup lets you visualize your data and build basic dashboards. You can then interact with the charts with your mouse. If you select a subset of data, it’ll get highlighted on other visualizations in real time. In many ways, it feels more like moving around Google Maps than manipulating data. Here’s what it looks like:
When it comes to use cases, Lakehal gave me a few examples. For instance, industrial companies use Vize to quickly process data from sensors, telecom companies use it to analyze logs, financial companies use it to analyze market data.
In many cases, Vize plans to replace Excel. While Excel is great in many cases, it’s not necessarily the best tool for the job. Vize costs $8,000 per user per year. The company has raised a little bit less than $900,000.