U.S. users are now spending the majority of their time consuming digital media within mobile applications, according to a new study released by comScore this morning. That means mobile apps, including the number 1 most popular app Facebook, eat up more of our time than desktop usage or mobile web surfing, accounting for 52% of the time spent using digital media. Combined with mobile web, mobile usage as a whole accounts for 60% of time spent, while desktop-based digital media consumption makes up the remaining 40%.
Apps today are driving the majority of media consumption activity, the report claims, now accounting for 7 our of every 8 minutes of media consumption on mobile devices. On smartphones, app activity is even higher, at 88% usage versus 82% on tablets.
App Users
The report also details several interesting figures related to how U.S. app users are interacting with these mobile applications, noting that over one-third today download at least one application per month. The average smartphone user downloads 3 apps per month.
However, something which may not have been well understood before is that much of that download activity is concentrated within a small segment of the smartphone population: the top 7% of smartphone owners accounting for nearly half of all the download activity in a given month. Those are some serious power users, apparently.
But no matter how often consumers are actively downloading apps, they certainly are addicted to them. More than half (57%) use apps every single day, while 26% of tablet owners do. And 79% of smartphone owners use apps nearly every day, saying they use them at least 26 days per month, versus 52% for tablet users.
[gallery ids="1047008,1047007,1047006,1047005,1047004,1047003,1047002,1047001,1047000,1046999,1046998,1046997"]
Facebook Still #1
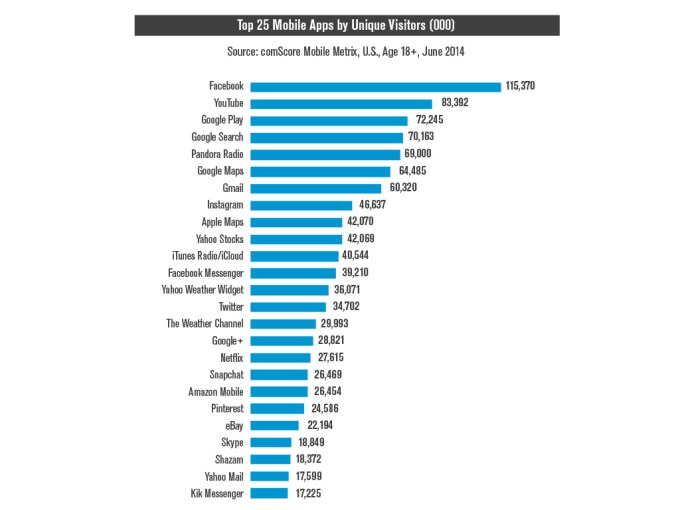
Here’s another notable tidbit: 42% of all app time on smartphones takes place in that individual’s single most used app. 3 out of 4 minutes is spent in the individual’s top 4 apps. The top brands, which account for 9 out of the top 10 most used apps, include Facebook, Google, Apple, Yahoo, Amazon and eBay.
Facebook is the most used app, in both audience size and share of time spent among each demographic segment.
Social Networking, Games and Radio contribute to nearly half the total time spent on apps, indicating mobile usage is heavily centered around entertainment and communication.
On iPhone, users prefer spending time consuming media, with news apps, radio, photos, social networking, and weather as the highest-ranking categories, while Android users spent more time in search (Google) and email (Gmail).
Android Vs. iPhone
ComScore’s report also heats up the ol’ Android versus iPhone war, pointing out again that iPhone users have 40% higher median incomes, and engage with more applications. (9 more hours per month).
More details are in the full report here.