After filing its S-1 for an IPO, Millennial Media, the largest independent ad network, is releasing a yearly report on performance of smartphone operating systems on its network in 2011. Continuing its growth as a platform on Millennial’s network, Android impressions grew 504 percent year-over-year.
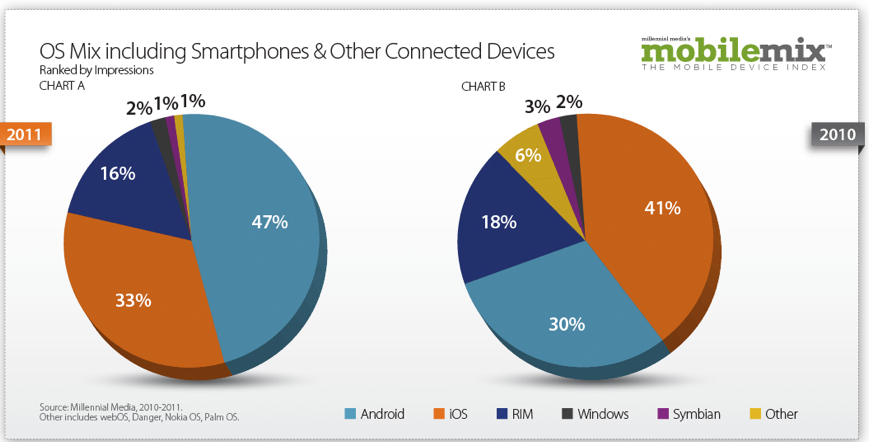
In 2011, Android had a 47 percent share of device OS impressions, while iOS had a 33 percent share. For basis of comparison, in 2010, iOS had the top spot with a 41 percent share, while Android made up 30 percent. iPhone impression share declined 7 percent year-over-year but maintained its position as the number one device on the Top 20 Mobile Phones ranking, with 15 percent of the impression share. Millennial says no other device has been able to achieve the same level of market share of the iPhone.
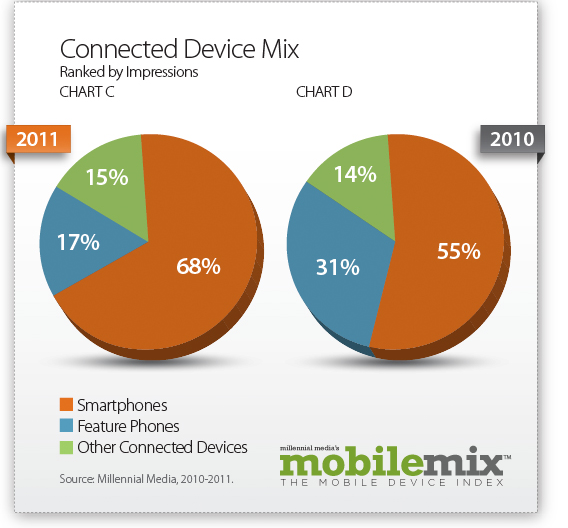
The Apple iPad has been the number one tablet on Millennial’s platform since its debut in early 2010, with Samsung’s Galaxy Tab in second place, garnering little more than half the impression share of the Apple iPad. Smartphones led the Connected Device Mix for the past two years, increasing 68 percent year-over-year, thanks to the decline in Feature Phone usage.
In terms of manufacturers, Apple was the top manufacturer on Millennial’s platform in 2011 and the iPhone was the top individual mobile phone (both were also on top in 2010). Apple’s impression share as a device manufacturer was relatively flat year-over-year; however the Apple iPad impressions grew substantially from 2010 to 2011.
Samsung was the number two device manufacturer on Millennial’s platform for two consecutive years, representing 17 percent of the Top 15 Manufacturers ranking in 2011. Samsung’s impression share was also relatively flat year-over-year. In terms of Android manufacturers that saw the biggest growth, HTC grew 79 percent year-over-year and was the number 3 manufacturer on Millennial’s platform in 2011.
Wi-Fi grew 21 percent year-over-year and accounted for 27 percent of the Carrier Mix in 2011, thanks to an increased number of Connected Devices on the platform.
In terms of app-specific data, gaming applications moved into the number one spot on Millennial’s Top Mobile Application Categories in 2011, growing 16 percent year-over-year. Music & Entertainment applications moved to the number two position, and news apps moved up five spots and grew 66 percent year-over-year.