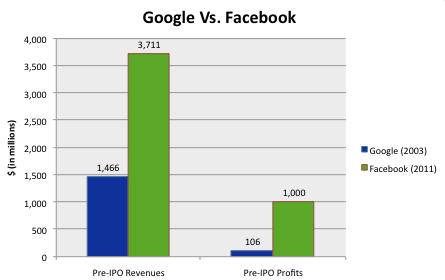
Now that Facebook is preparing the biggest tech IPO in history, it is possible to compare its financials and potential market value to Google’s when it went public. At first glance, all of Facebook’s numbers look bigger. Its pre-IPO revenues of $3.7 billion in 2011 are more than two and a half times larger than Google’s 2003 revenues of $1.5 billion (Google’s IPO was in 2004). Facebook’s $1 billion in profits is ten times larger than Google’s pre-IPO profits of $106 million. And its expected market cap of between $85 billion and $100 billion will dwarf Google’s IPO market cap of $23 billion.
Facebook, no doubt, will be emphasizing these differences. But in many ways it is a false comparison. Facebook is going public after 8 years as a private company. Google went public much earlier in its development, after 5 full years. So, yes, Facebook at Year 8 is much bigger than Google was at Year 5 of its trajectory. A better way to see how the two companies stack up is to compare their revenues and profits at the same points in their histories. In 2008, Facebook’s fifth year of existence, its revenues were only $272 million, and it lost $56 million.
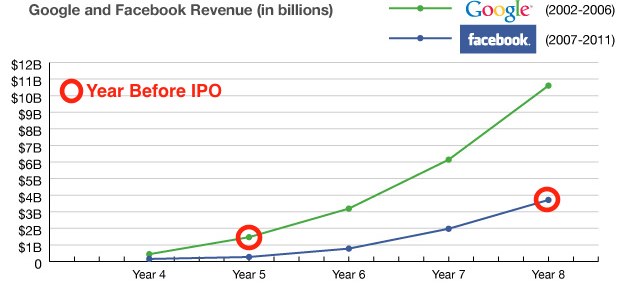
If you chart Facebook’s revenues for the past five years and compare them to Google’s for the five-year period preceding its IPO (see below), a truer picture emerges of each company’s size at similar points in time. You need to compare Facebook as a 5-year-old to Google as a 5-year-old.
Matching both companies year-for-year, its is clear that Google grew faster and was always substantially bigger no matter what year you look at. Year 8 for Google was 2006, when its revenues were $10.6 billion and its profits were $3.5 billion. As an 8-year-old, Google’s profits were almost as large as Facebook’s revenues as an 8-year-old. (Google was incorporated in September, 1998, so I am using 1999 as Year 1 for the purposes of this analysis. Facebook started in January, 2004, which I am counting as it’s first full year).
But which company grew faster? It turns out that the 5-year compound annual growth rate for each one’s revenues during these comparable periods (2002-2006 for Google, and 2007-2011 for Facebook) was almost exactly the same: 89 percent a year (Facebook grew a smidgen faster at 89.22 percent a year versus 88.96 percent for Google, but Google started with almost twice the revenue and thus ended up much larger five years later).
Facebook’s growth is astounding, but it is important to keep it in perspective. In many ways, it is still trying to catch up to Google’s past.