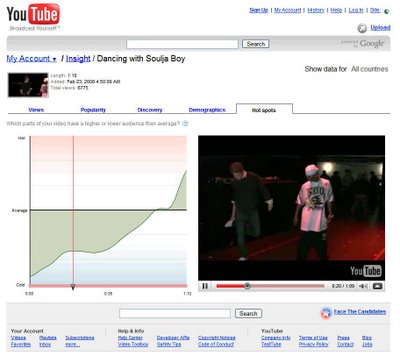
YouTube has launched a new feature as part of its Insight tool for content creators that allows members to visually examine exactly where in their videos their viewers gain and lose interest. The new feature, called Hot Spots, displays the dropoff data in a dynamic graph that can be viewed alongside the original video.
To determine which points in a video are “hot”, Hot Spots compares each video to other videos of similar length on YouTube – if people are leaving more quickly than average at a given time, you’ll know you have some tweaking to do. The site also tracks rewind and fast forward data, so you can see if viewers are repeatedly watching a certain segment.
There are a number of obvious applications for the new feature: publishers can objectively determine which segments of the video are the most appealing, and edit their content accordingly. Advertisers can use multiple YouTube videos to run different versions of an ad to see which ones are the most effective. Other users will likely find more creative applications – I wouldn’t be surprised to see a comedian test out a stream of jokes to see which ones bomb.
You can read more about the announcement here.