
Building a high-growth SaaS company is never easy, but founders who are feeling like the job is more challenging than ever aren’t imagining things — economic shifts over the past two years have profoundly impacted the landscape.
In 2023, SaaS companies’ year-over-year growth rate plummeted to its lowest point in the past five years. As a result, organizations scrambled to secure their financial footing through hiring freezes and RIFs, optimizing toolset utilization, and introducing performance management initiatives. However, finding the thin line between managing costs while continuing to fuel growth is highly nuanced, requiring an evolved approach to monitoring and measuring business health.
When cost-cutting isn’t practical, it becomes clear that more creative changes are needed to right the ship. Adapting to this new reality requires the industry to reassess how to measure success and what to measure. Traditional success metrics like the Rule of 40 and Magic Number must be revised amid an unpredictable and competitive market.
But if the old playbook no longer applies, how can companies benchmark their performance for our new normal? As head of analytics at ICONIQ Growth, I have spoken to and surveyed nearly 100 SaaS companies and analyzed more than 10 years of their operating and financial data that is not available to the general public. These companies span from $1 million ARR to post-IPO, providing the most transparent view of the SaaS industry at every stage.
What we learned could fill a book (and indeed, our Topline Growth and Operational Efficiency report spans nearly 70 pages of insights). Still, we felt it was important to summarize some of the fundamental shifts in strategy that SaaS companies should consider adopting in 2024 to unlock growth and new industry benchmarks that will help these teams get a more accurate picture of how their performance stacks up in today’s environment.
Reassessing pricing models to unlock growth
Traditional success metrics like the Rule of 40 and Magic Number must be revised amid an unpredictable and competitive market.
Traditional licensing and seat-based pricing have long been the go-to model for SaaS companies. While this approach may serve most companies well at first, it could mean leaving money on the table in the long run.
Our research shows that growth rate decreases as companies scale, with companies achieving high growth in the early parts of their life cycle thanks to signing on net new customers to add to a small but growing base. However, once companies reach ~$100 million ARR, expansion becomes the name of the game and the primary driver for growth.
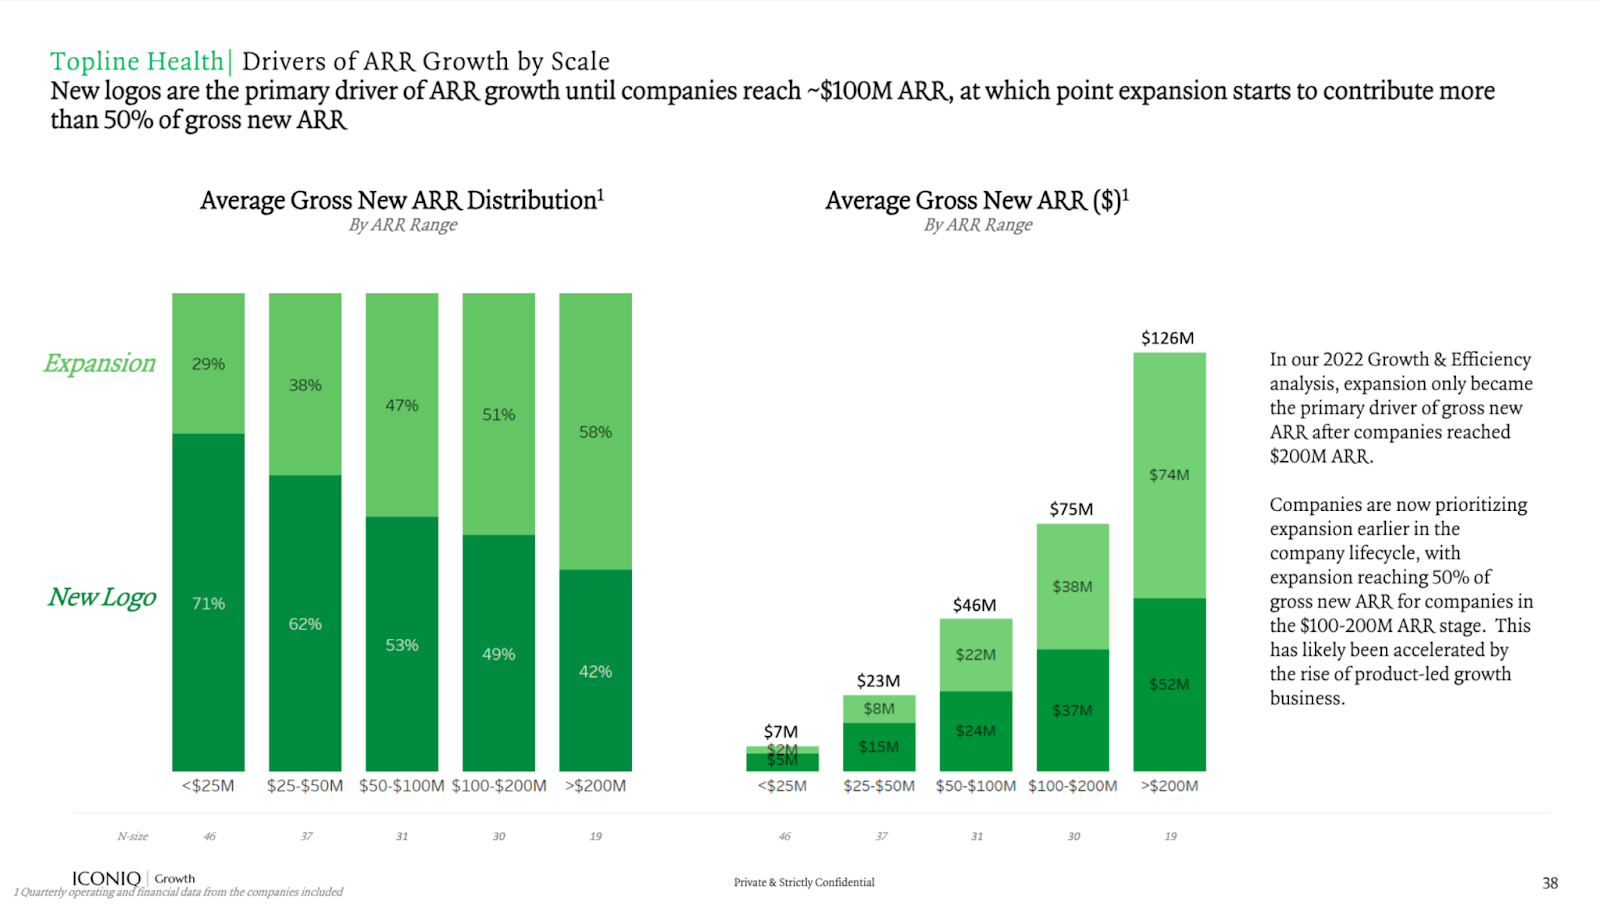
Image Credits: ICONIQ Growth
With seat-based pricing, expansion is possible, but customers who are watching their spend will put off paying for additional seats and make do with their plans as long as possible. In this paradigm, teams must effectively resell their product to existing customers to grow.
This is why companies should question the status quo and consider newer pricing models like usage-based pricing (UBP), where appropriate (i.e., depending on product, target customer type, and sales motion). UBP has gained traction over the last five years, and it’s easy to see why. By basing pricing on usage instead of the traditional licensing or by-seat models, teams are encouraged to optimize efficiency.
UBP is also a strong choice due to its potential to streamline customer acquisition, provide a more predictable revenue stream, and enhance customer satisfaction by eliminating any sense of being “oversold.” This approach aligns with incentives, as pricing is based on value rather than seats.
In a side-by-side comparison, UBP models outperform subscriptions with ~200% YoY growth. That said, UBP is inherently volatile. While shifting away from subscriptions helps combat the decreasing growth rate, we expect significant fluctuations and much higher ranges in net dollar retention in parallel with market changes.
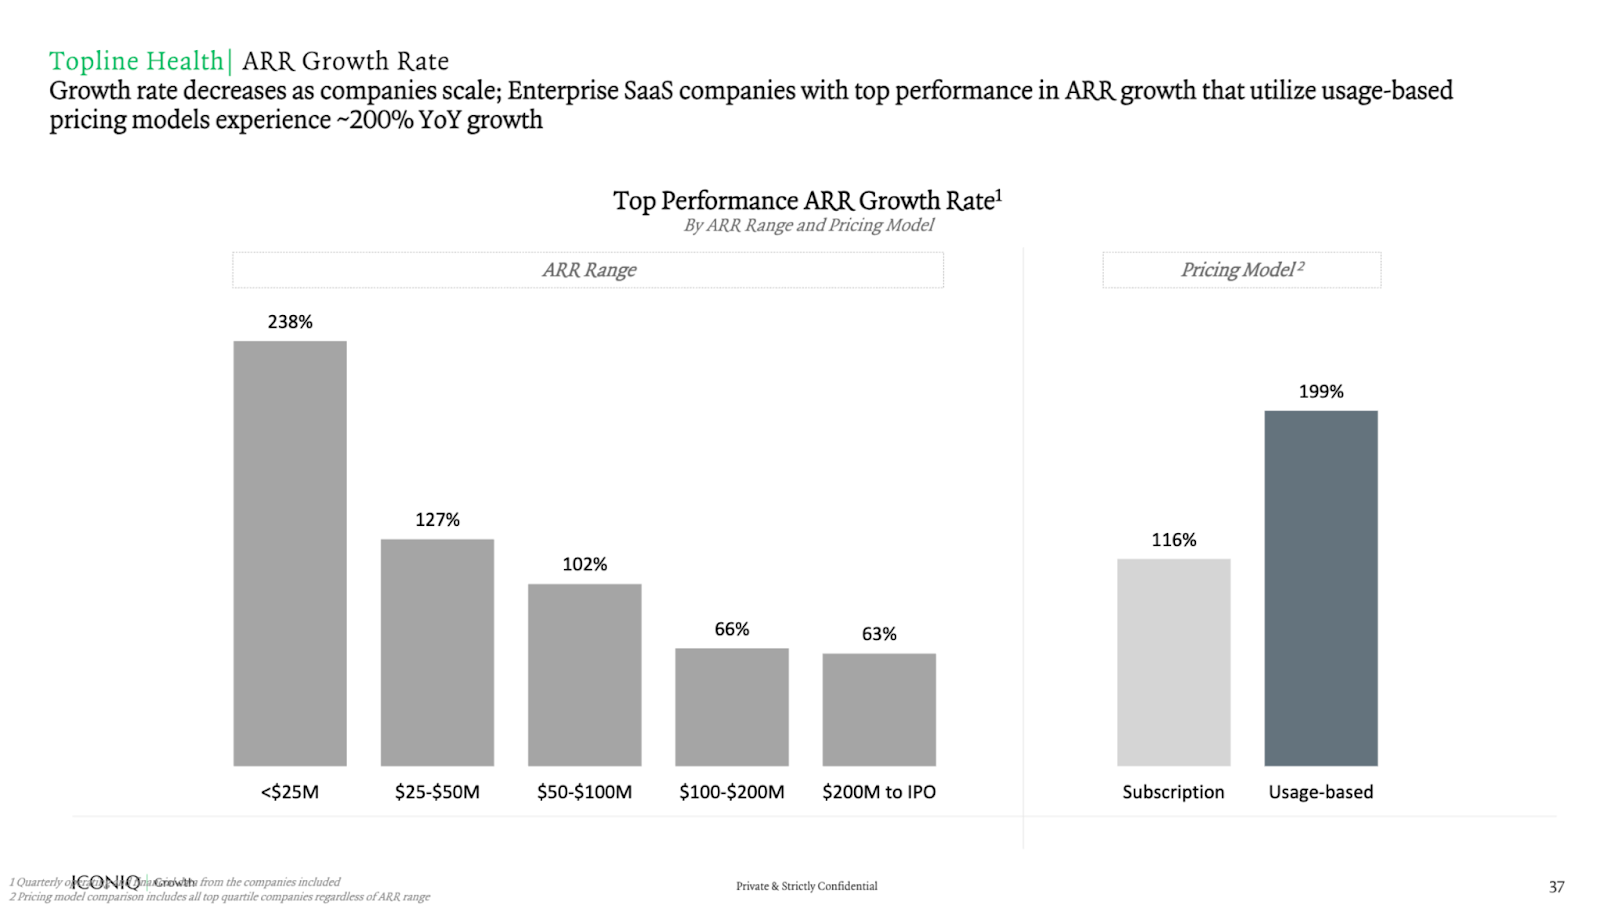
Image Credits: ICONIQ Growth
Setting new benchmarks for performance and resiliency
The hostile market and bevy of new tools mean old benchmarks and goalposts must better reflect what success means today. For example, one classic SaaS financial metric is the Rule of 40, which states that the combined revenue growth rate and profit margin should equal or exceed 40%, and startups that hit this metric sustainably generate a balance of growth and profitability.
This metric was the gold standard when it was coined in 2015, but market hostility and innovation in business efficiency means the Rule of 40 is no longer the relevant benchmark it used to be.
Today, we believe that the combined revenue growth rate and profit margin should now equal or exceed 60% — not 40% — to earn capital at a sustainable rate. Instacart’s and Klaviyo’s recent IPOs were clear case studies in this new paradigm, with an LTM rule of 53% and 66%, respectively, leading up to the IPO. With the rise of AI, processes that used to take weeks should now take mere days, and companies need to leverage these new strategies to catch up.
However, it’s more than just the Rule of 40 that needs to be reevaluated — while businesses still need to prioritize critical measures of health, including The ICONIQ Growth’s Enterprise Five: ARR growth, net dollar retention, Rule of 40, Net Magic Number, and ARR per FTE, there is a new framework for evaluating the success of your SaaS company — which we have coined the Resiliency Rubric.
One of the biggest challenges for companies navigating turbulent markets is getting a clear picture of what success looks like, so we’ve identified five key metrics — and provided the current industry benchmarks from SaaS peers — that can be used as a “Resiliency Rubric” to benchmark your company’s fortitude amid volatility: quick ratio, topline attainment, burn multiple, CAC payback, and productivity ratio.
Quick ratio
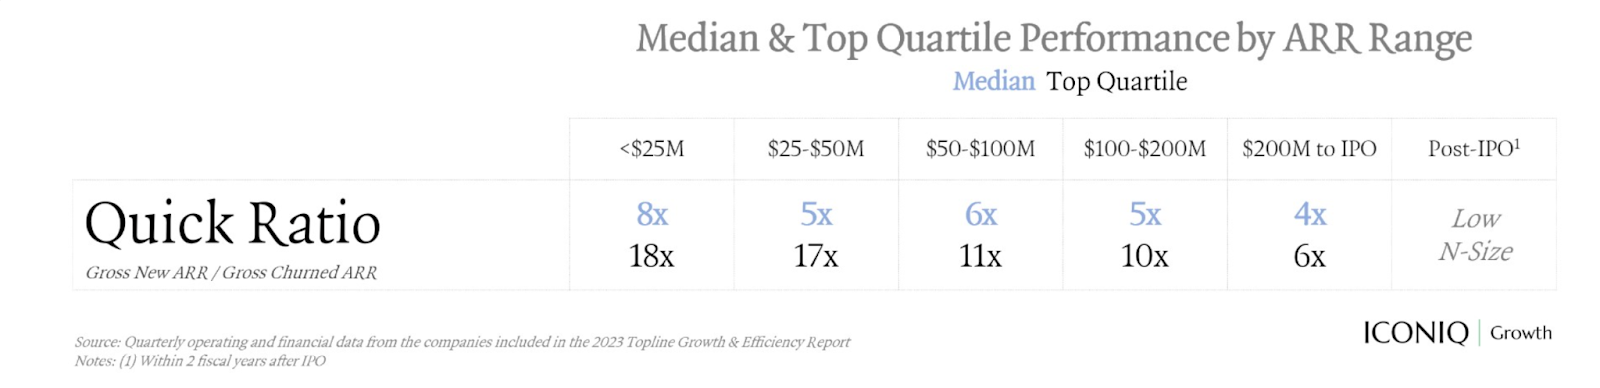
Quick ratio measures how efficiently a company grows by comparing bookings growth against contraction. As companies scale, the growth rate naturally slows while churn increases due to a growing customer base. This means that the quick ratio will naturally decrease. However, top-quartile companies can maintain a quick ratio above 4x even after reaching $100 million ARR. In other words, for every $1 of lost ARR, these companies add $4 in recurring revenue.
This metric can be particularly relevant for early-stage businesses where metrics like Rule of 60 are typically less applicable due to the speed of growth and aggressiveness. We found that top SaaS companies in the $50 million to $100 million ARR range had a quick ratio (gross new ARR/gross churned ARR) of 11x versus the industry average of 6x.
Topline attainment
One of the most critical measures of business predictability is topline attainment, which measures the actual dollars achieved each quarter against the original plan set at the beginning of the year. This metric becomes particularly critical as companies scale and approach IPO.
Companies should achieve 100% quarterly net new attainment of their topline plan, regardless of scale. Our research found that top performers have managed to stay in the 80% to 100% range regardless of scale in the current environment.
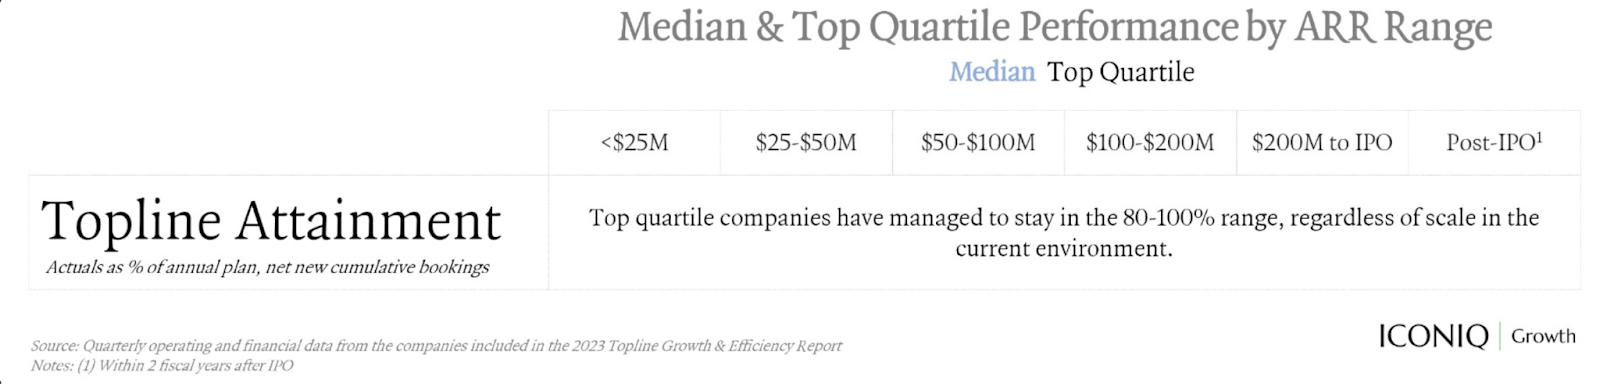
Image Credits: ICONIQ Growth
Burn multiple
The burn multiple measures the effectiveness of capital expenditures by comparing spend to the net new revenue being generated each quarter. In other words, how much is a company burning to generate each incremental dollar of recurring revenue?
During times of uncertainty, SaaS companies need to develop a leaner organizational muscle that favors efficiency and extends runway. We found that top SaaS companies in the $50 million to $100 million ARR range had a burn multiple (FCF/net new ARR) of 0.5x versus the industry average of 0.9x.
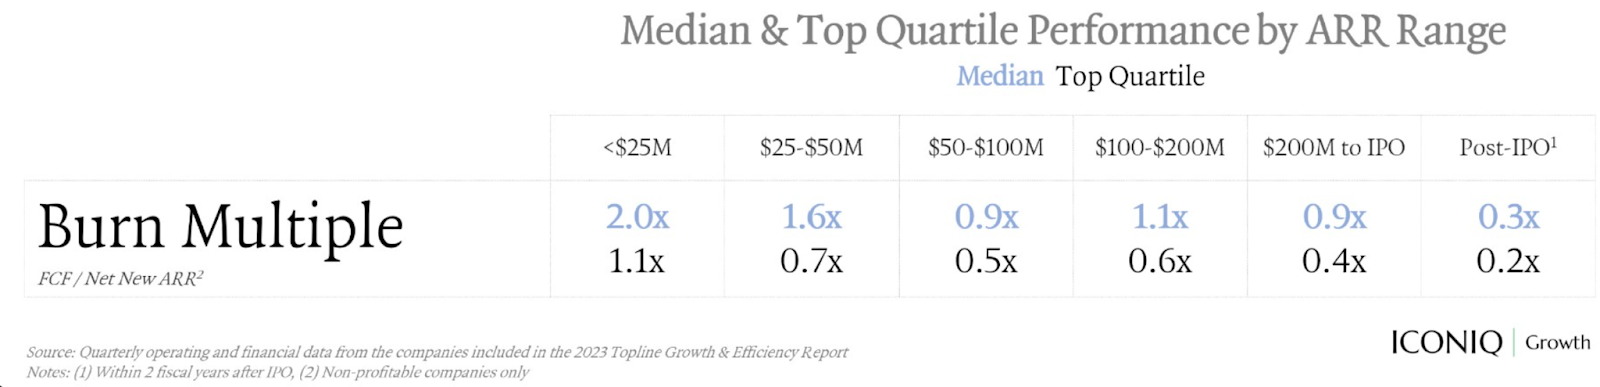
Image Credits: ICONIQ Growth
CAC payback
Customer acquisition cost (CAC) payback measures how long it takes to break even on acquiring a new customer and is an additional measure of sales efficiency. It is important to note that this metric will vary based on sales motion, customer segment, and other business model nuances.
Based on our analysis, we consider a CAC payback period of under 12 months to be exceptional; in today’s environment, where acquiring new customers has become much more challenging, we see CAC paybacks closer to 20 to 30 months as the average.

Image Credits: ICONIQ Growth
Productivity ratio
This metric looks at the ratio between the average ARR per FTE and average total OpEx (operating expenditure) per FTE; in other words, how much revenue is being generated per employee versus how much spend is being invested per employee. This measurement can help inform business decisions around hiring or reductions in force in times of uncertainty and highlights the trade-offs between headcount, revenue growth, and profitability.
As companies scale, the productivity ratio generally surpasses 1x, at which point the average ARR being generated per FTE starts to outpace total spend. This target of 1x+ usually becomes achievable and more relevant once companies get close to the $100 million ARR mark.
Companies with a productivity ratio under 1x may find it helpful to look at not only people costs (i.e., payroll, headcount, onshore vs. offshore mix), but also the direct investments in its workforce to improve productivity (i.e., L&D [learning and development], training, performance management).

Image Credits: ICONIQ Growth
The strategies employed by SaaS companies are constantly evolving, but market downturns serve as the proving grounds on which truly resilient business models are made. While knowing exactly how long a downturn will last is impossible, companies that can navigate this turbulence by fostering resilience, maximizing efficiency, and adapting their benchmarking metrics will be better positioned to capitalize on favorable market conditions and weather any future economic storms.