
You’ve probably downloaded an app or visited a website and just closed it before getting much use out of it. You could have done this for a variety of reasons: Maybe the product seemed too daunting, or maybe there was a gated subscription. I’m sure this list can go on for pages.
In my opinion, a growth marketing funnel consists of three main pillars: acquisition, activation and retention. Activation is the second step in the funnel and involves pushing users to complete a desired behavior or action.
But the reality is, approximately 95.87% of iOS users drop off after day 30, according to Statista’s 2021 Q3 report. As a startup founder, how do you prevent leakage after spending significant resources to acquire people at the top of the funnel?
Finding the right metric
When building product features, the focus should be on how to push users to your activation metric.
The most important part of activation is identifying the right metric and rallying the entire team around it. This isn’t as simple as getting users from action A to action B (i.e., from install to sign up). What good does that do if the post-signup drop-off is 95%?
Instead, think of activation as getting users to a point where you know for sure that they will stay for a longer period of time. Facebook famously found that the “seven friends in 10 days” mantra was the metric that made users stay, so they pushed heavily on activating users to that point.
Which metrics separate customers who find value in your product from those who don’t?
Start by picking and prioritizing actions specific to your product. This can be platform-usage minutes, the number of messages a user sends, how many people a user follows, the number of times a user personalizes their avatar or anything that provides a signal on how users are finding value in your product.
Finding this metric may not come easily and will probably require slicing your data, but the output activation metric is crucial for targeting the right goals.
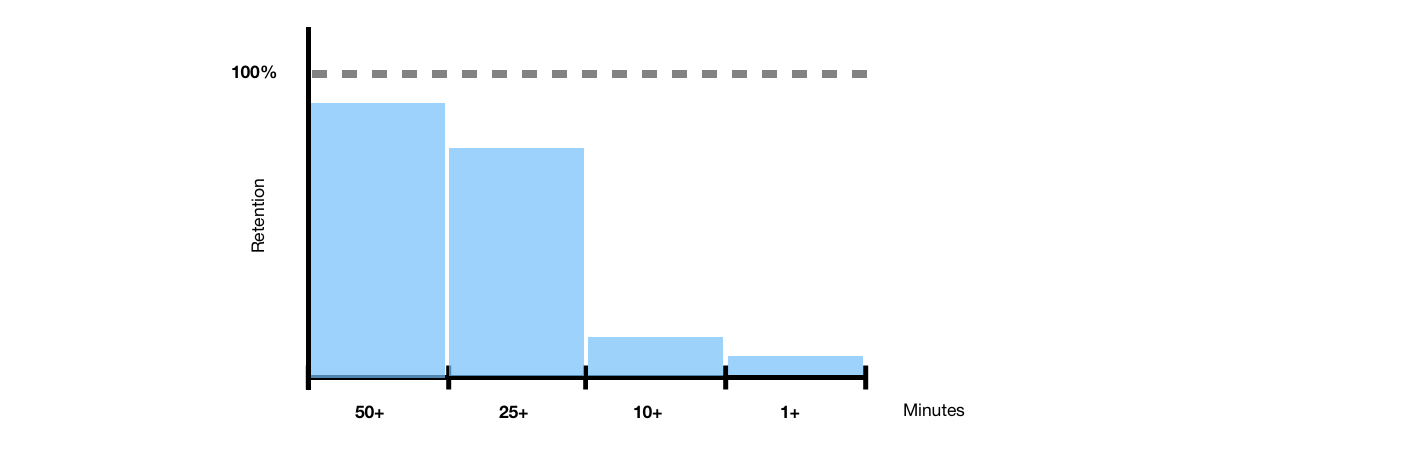
Simulation of what retention would look like if a SaaS platform activated users to certain usage minutes within the first week. Image Credits: Jonathan Martinez
In the above example (with sample data), a SaaS platform finds that it must get users to 25+ minutes of usage within the first week to avoid a major drop-off at the next point.
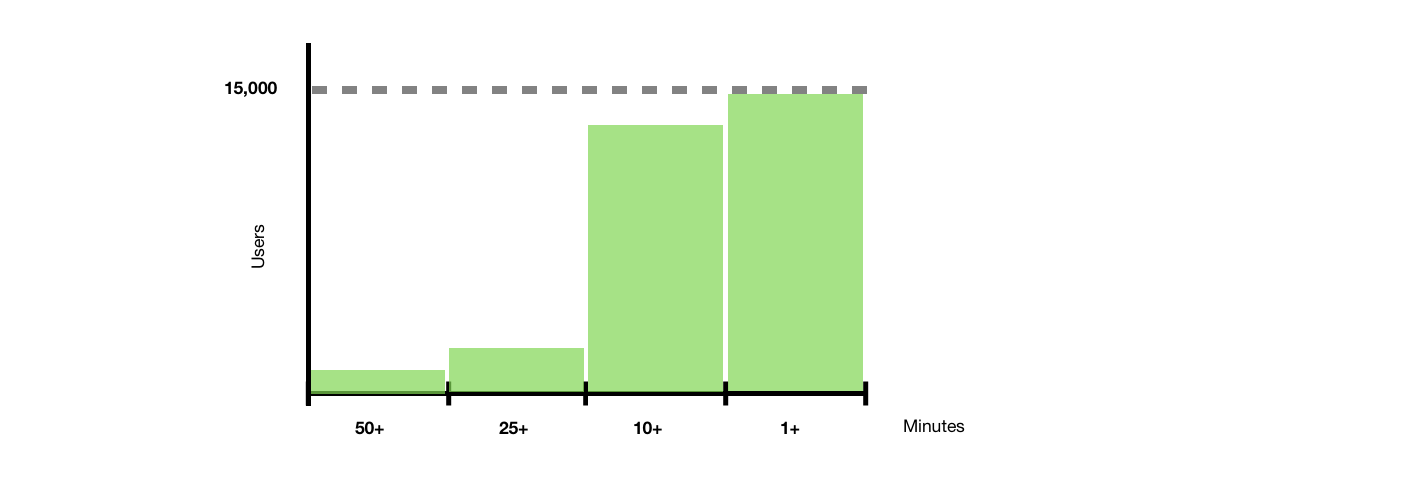
Simulation of first-week users within each usage minute bucket for a SaaS platform. Image Credits: Jonathan Martinez
It’s also imperative to dig deeper and understand the number of users within each bucket. We see above that the 25+ minutes bucket is smaller than the 10+ and 1+ minutes buckets. In this case, because the 25+ minutes user pool is so small, we need to run analyses to understand which cohort to target.
Below is a quick example analysis:
- 4,000 users x 75% retention = 3,000 users
- 13,000 users x 10% retention = 1,300 users
After analyzing these two buckets, it makes sense to activate users to reach 25+ minutes despite the larger pool at 10+ minutes.
Activating users
Once you’ve decided on a metric, start thinking about how to get users to take the desired action. The two main components to prioritize would be product and growth life cycle (email/notification).
Twitter is a great example of encouraging users to both activate and keep returning. During Twitter’s sign-up flow, you’re asked what your interests are, and it compiles a list of users you should be following based on your answers.
There’s a reason Twitter’s sign-up flow is tailored the way it is. It’s likely the company learned that encouraging a user to follow four people on their first day leads to a 50% increase in retention. I’m sure hundreds of hours have gone into the data analysis for this model.
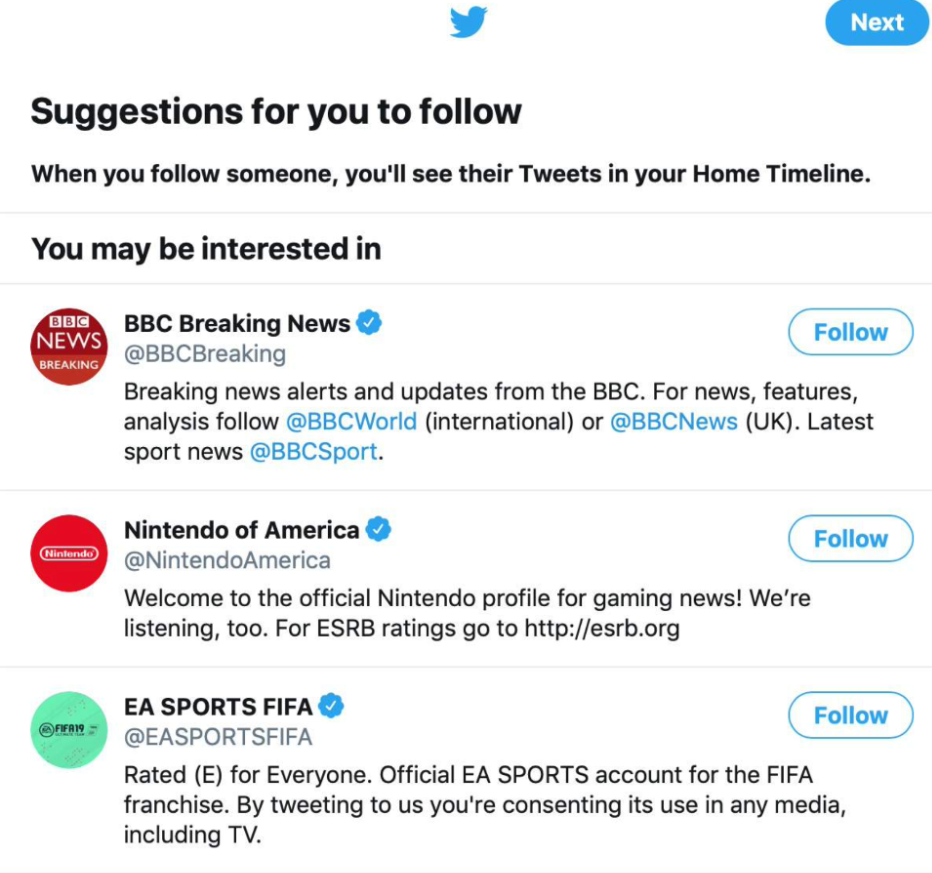
Twitter’s sign-up flow prompts users with suggestions on who to follow. Image Credits: Twitter
When building product features, the focus should be on how to push users to your activation metric. Continuing with the SaaS simulation example, we want to prioritize how to get users to 25+ minutes in their first week. To that end, which product features are currently increasing usage time? How do we get more users to start using those features? What additional features would lead to more time spent on the platform in the first week?
The Habit Loop framework, coined by journalist Charles Duhigg, is applicable to answering our question about product features. The framework uses three simple steps to create habits: cue, routine and reward. For Twitter, the following could be one of the many habit loops at play:
- Cue: boredom.
- Routine: scrolls feed on Twitter.
- Reward: gets interesting content from followed users.
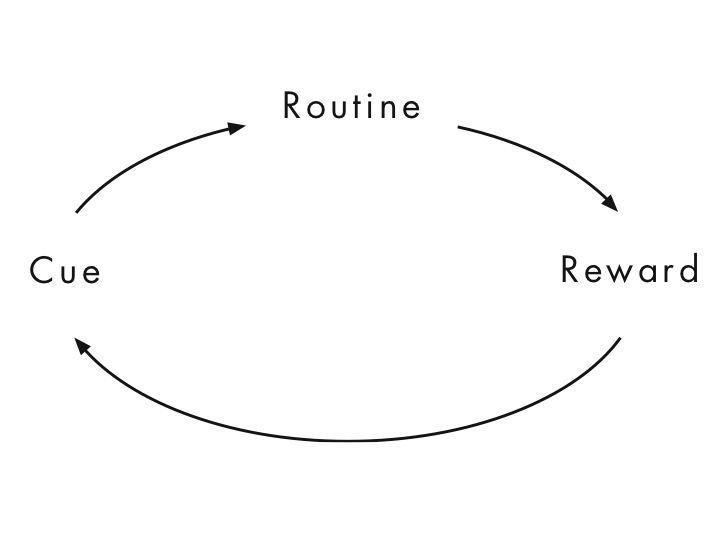
Image Credits: Charles Duhigg
Measuring success
Once you’ve selected an activation metric and your team’s ready to build and optimize it, it’s time to build an experimentation roadmap with features and optimizations to improve the activation metric.
Continuing with the SaaS example, adding a tutorial on the first load may help boost time spent on the platform in the first week. This could potentially lead users to the meat of the product sooner, thus increasing usage. Experimentation roadmaps can be as robust as you want, but at the most foundational level, items should be stack-ranked based on implementation difficulty and expected lift.
When measuring the results from each experiment, it’s important to consider the quantitative lift as well as the NPS and feedback. Increasing friction to improve your activation metric will only backfire in the long run. The goal should be to push the needle on quantitative metrics first while being conscious about your customer’s happiness score.
To increase testing throughput, create specific activation dashboards on your business intelligence tool to minimize time spent on analyzing data from each experiment.
Activation is a vital piece of the growth framework, and by optimizing for the correct metric, your startup will can grow by leaps and bounds.