
With more money flowing into a shrinking number of deals, the average startup funding round is getting bigger. And it’s not by a small margin, either. Supergiant funding rounds are coming to dominate the funding landscape at all stages.
Although a lot of attention has been paid to huge funding rounds at the later stage — in particular, the recent spate of mega-rounds led by SoftBank’s $100 billion Vision Fund — outsized rounds abound at all stages. Crunchbase News has also explored some of the smallest funding rounds startups raise. But up to this point, we haven’t taken a look at big rounds at early stages. And this is a somewhat glaring omission, because seed and early-stage funding rounds make up the surpassing majority of deal volume around the world.
If you’ll forgive the pun, it’s kind of a big deal.
Today, we’re going to take a look at this growing phenomenon, what it means and what might be happening “under the hood” in supergiant seed rounds.
The rise and rise of supergiant rounds
In this section, we’re going to zip through a fairly large amount of funding data rather quickly. The exact numbers are less important than the overall trends they indicate. To wit, that both middle-of-the-road rounds and their supergiant counterparts alike have grown significantly in size over the past decade.
But before showing the charts and analyzing the data behind them, allow us a second to explain what, exactly, we’re talking about when we talk about supergiant rounds.
For our purposes here, we’ve borrowed the term “supergiant” from astronomy. Supergiant stars, as the name may suggest, are some of the most massive and luminous celestial bodies in the universe. Similarly, the supergiant funding rounds we’re examining here are among the largest raised by startups, and they’re the rounds that grab the most headlines.
Hunting for giants
We define the set of “supergiant” rounds as the top 10 percent of deals struck for each round type, by year. So, for example, if there were 5,000 seed rounds closed in a given year, the “supergiants” would be the top 500 seed rounds — ranked by the amount of money raised — for that year. Likewise, if there were 1,500 Series A rounds closed in that same year, we’d call the 150 largest Series A rounds supergiants, as well.
The following analysis is based on a data set of more than 44,000 seed, angel, Series A, Series B, Series C and Series D rounds raised by startups headquartered in the U.S. and Canada between 2008 and mid-February 2018. We’ll compare the average size of supergiant rounds against a trimmed average of round sizes, which doesn’t include the top or bottom 10 percent of rounds.
Why go with a trimmed average? We want to exclude the supergiant rounds because they’d artificially skew the general average upward, but by the same token, we want to filter out the smallest rounds (like this listed $33,000 Series B, for example) that would artificially skew figures lower. To reiterate, by comparing an average of the median 80 percent rounds to the average of the top 10 percent of rounds, we’ll be able to see how supergiant round sizes related to those “in the middle of the road” over the past decade.
Our primary focus here will be deals from the earliest stages — seed and angel, Series A and Series B — but we’ll get into some findings from later stages, too. Let’s start with the earliest rounds and move later from there. And once we’ve shown the data, we’ll share some observations gleaned from it.
Seed and angel rounds
For the approximately 24,600 seed and angel rounds we analyzed, we found that the size of both middle-of-the-road and supergiant rounds have grown significantly over the past decade, as the chart below shows.
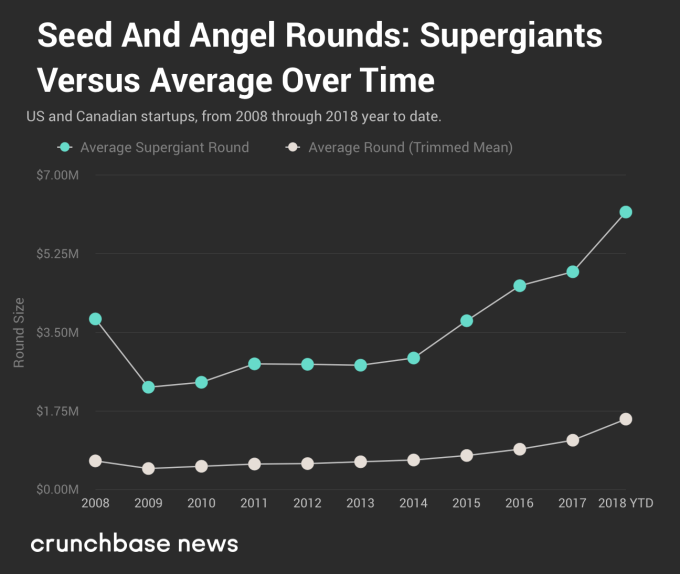
The size of middle-of-the-road seed and angel rounds grew by roughly 145 percent over the course of the last 10 years, and supergiant rounds are just under 63 percent larger than the supergiant average from a decade ago.
And — in what will become a common refrain — the companies that raised these large rounds are primarily located in just a few cities.
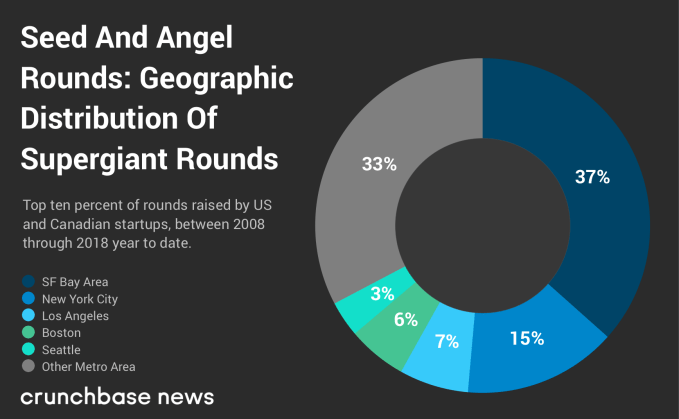
A majority of supergiant seed and angel rounds were raised by startups based in the SF Bay Area and New York City. Let’s see if the same pattern occurs at Series A.
Series A rounds
Like with seed and angel rounds, the chart below aggregates data from nearly 10,000 rounds and shows how much Series A rounds have grown over the past decade.
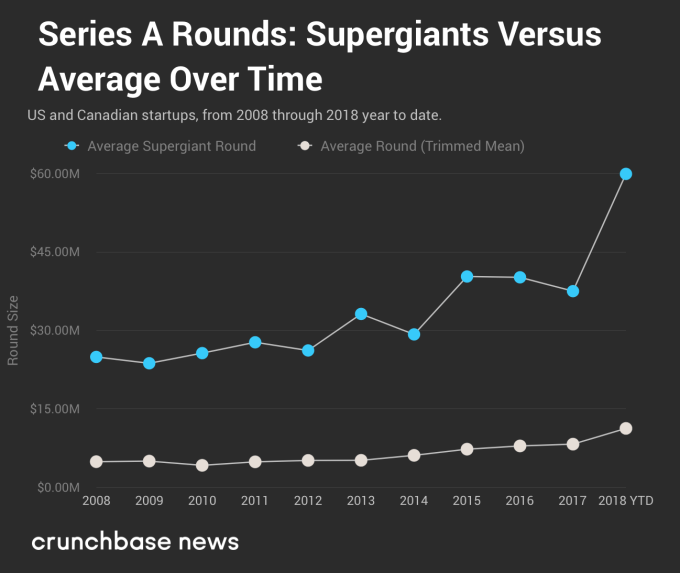
The size of supergiant Series A rounds grew by a similar amount to middle-of-the-road seed and angel deals, increasing by 140 percent over the course of the last 10 years. More pedestrian Series A rounds are just under 130 percent larger, up from a trimmed average of $4.93 million in 2008 to $11.29 million in 2018, year to date.
The distribution of startups raising supergiant Series A rounds is similar to even earlier-stage counterparts.
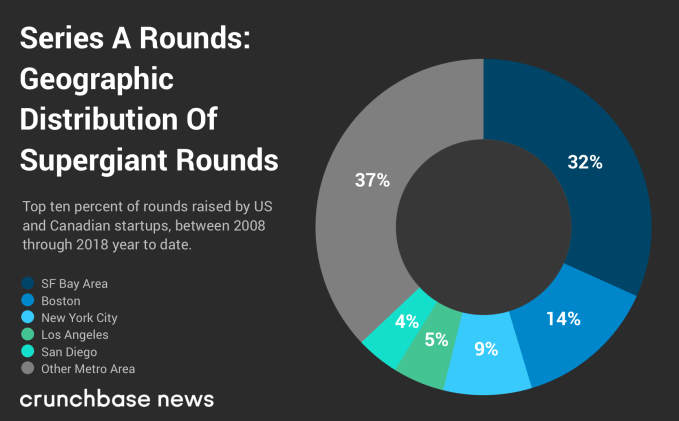
Again, a majority of supergiant Series A rounds are raised by startups headquartered in just a few cities. In addition to San Francisco and New York City, life sciences-heavy Boston takes second place in the ranking of a decade’s worth of huge Series A rounds.
Last but not least, it’s on to Series B.
Series B rounds
Our Series B data set contained nearly 5,700 Series B deals, but, unlike earlier rounds, the general “up and to the right” trendline isn’t so clear. As the chart below shows, it appears as though the size of Series B rounds has somewhat leveled off, at least on an annual timescale.
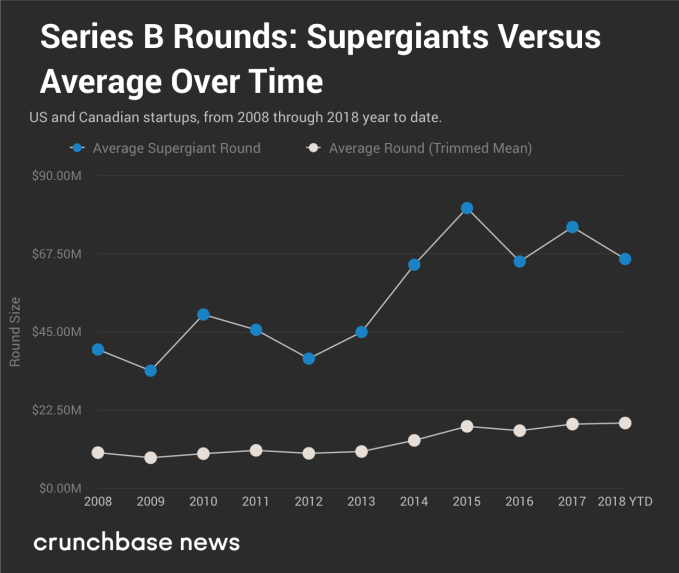
Supergiant Series B rounds have grown by 65 percent over the last decade. The more middle-of-the-road Series B rounds have also grown, but by a more significant 83 percent since 2008.
The geographic distribution of startups that raised the most supergiant Series B rounds is strikingly similar to the population of Series A fundraisers.

Again, San Francisco and the broader Bay Area ranks at the top of the charts, followed by Boston, NYC, Los Angeles and San Diego — the same rank order as the prior round type.
And now that we’ve got the raw data out there, let’s see what we can take away from all of this.
The pie shrinks as the middle grows
Higher growth rates amongst middle-of-the-road rounds
Although the growing size of supergiant rounds may be impressive due to sheer size alone, it’s actually middle-of-the-road rounds that have grown the most consistently over the past decade.
In two of the three round types we reviewed above, the compound annual growth rate (or CAGR, for those of you who like acronyms) of supergiants underperformed more quotidian rounds, as the table below shows.
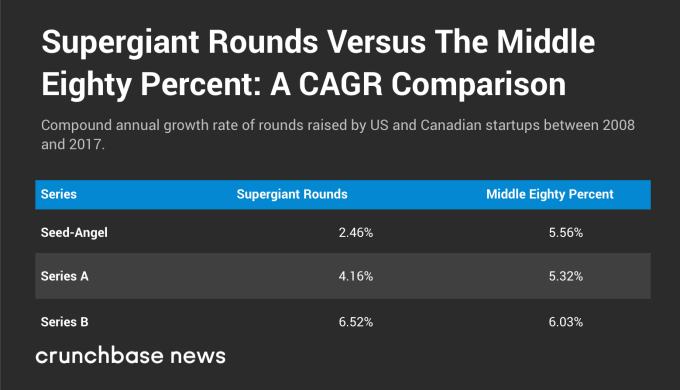
This all suggests that despite supergiant rounds getting all the attention, performance in more middle-of-the-road rounds has been even better, at least from a dollars-raised standpoint.
Growing geographic concentration of supergiant rounds
By definition, supergiant rounds suck up a lot of capital, and they seem to be primarily located in just a few deep pools. As the funding cycle progresses, it appears as though more of the supergiant rounds are raised in just a handful of cities.
As the funding cycle progresses, the percentage of rounds raised by startups located in the top three cities seems to increase after an initial drop following seed. Fifty-five percent of supergiant Series A rounds were raised by startups from the Bay Area, NYC and Los Angeles. Although not pictured above, 67 percent of supergiant Series C deals were struck by companies from the Bay Area, Boston and New York City.
But what’s even more striking is the declining percentage share of supergiant rounds raised by startups outside the top-five rankings for a particular stage.
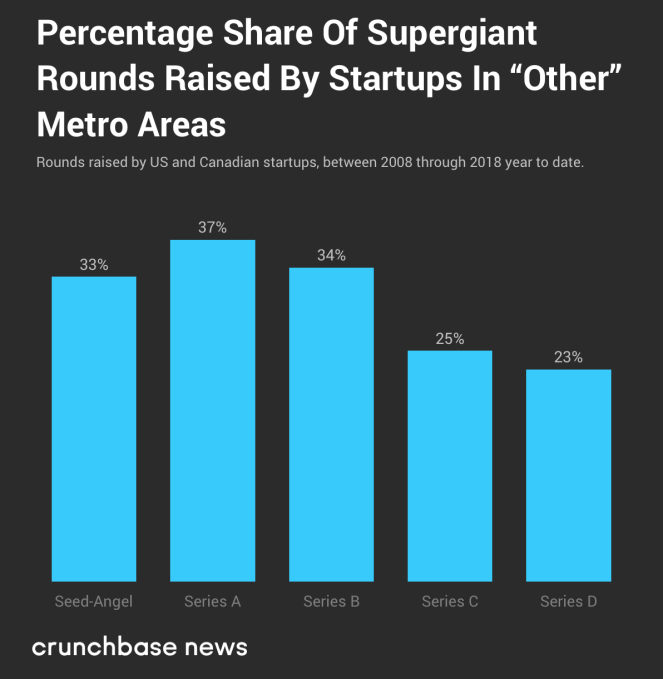
The chart above shows that the ability to close very large rounds is generally concentrated in fewer and fewer places as the funding cycle progresses.
We stopped our analysis at Series D due to limited sample size.
The growing dominance of supergiant rounds
Some have shown that it’s not just the average round size that’s growing across most stages over time, but the number of large outlier rounds, as well. For example, Seth Levine, a venture investor at Foundry Group, found that the proportion of Series A deals larger than $50 million grew by an astonishing 721 percent from 2008 to 2017. The share of Series B rounds in the $50 million-plus range grew 300 percent over the same period. He concluded that “venture is being increasingly driven by large rounds.”
Inspired by Levine’s research, Ian Hathaway, an economist, and strategy advisor, found that between 2007 and 2017, deal volume has declined while dollar volume rose across almost all stages of funding he analyzed. This is in line with analysis from Crunchbase News from late 2017. And in a follow-up to prior analysis, he charted the growing number of large rounds over that time period.
Indeed, it was Levine and Hathaway’s analysis that prompted us to look at the numbers, as well, albeit from a slightly different angle, one more focused on geography and population-scale shifts in round size at the highest end of the spectrum. Our findings confirm a piece of common sense: expensive cities (see: NYC and the Bay Area) and those home to capital-intensive industries like biotechnology and advanced manufacturing (see: Boston and San Diego) are the primary drivers and beneficiaries of the trend toward supergiant rounds.
A decade’s worth of history suggests that this is one status quo that won’t be disrupted soon, no matter how much “disruptive” startups may raise in the future.