In the world of venture capital, the prospect of a successful “exit” looms large in the minds of investors. A VC’s business model is less about the money that goes into a startup than it is about what comes out. It’s true that most companies fail to exit gracefully, and of those that do, surprisingly few exit by going public. The majority of exits take place through mergers and acquisitions (M&A).
For most investors of this ilk, it’s not always the size of the exit that matters; rather, the focus is placed on the ratio of exit valuation to invested capital (VIC). Crunchbase News has previously covered exits that delivered high VIC ratios — or those that brought “the biggest bang” for the proverbial buck — and we’ve found that mobile and related sectors are particularly fertile ground for high-VIC M&A events.
But there are a couple of more general questions to be asked and answered than in those articles. For instance, from the standpoint of VIC multiples, are larger exits better? And are companies that have raised less venture funding more likely to generate higher multiples? These answers can be found.
But before getting into the weeds, let’s clear out some reminders and disclaimers. We’re not answering the question “Are startups with less venture funding more or less likely to exit?” Crunchbase News has already taken a stab at that question and found that, unless a startup raised less than around $9 million in venture funding, there isn’t a strong correlation between total capital raised and likelihood of being acquired. And like that previous foray into exit data, we’re only looking at mergers and acquisitions because there’s a larger sample set to be found.
If you’re interested in what kind of data we used for this analysis, skip to the end of the post for notes on methodology. If not, read on for answers.
Big exits are better exits for multiples
When it comes to acquisitions, in general, bigger is better if the goal is to deliver a high ratio of valuation to invested capital.
The chart below displays VIC multiple data on the vertical axis and the acquisition value on the horizontal axis. Keep in mind that this chart uses a logarithmic scale (e.g. based on powers of 10) on both axes to include the very broad range of results.
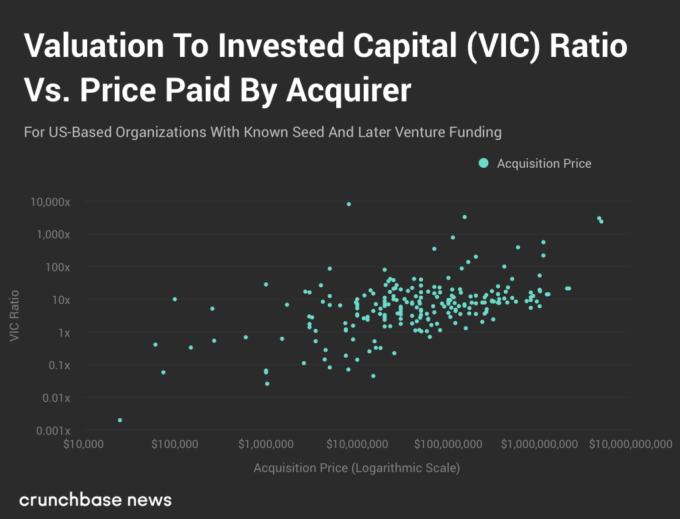
Based on the 225 acquisition events in this data set, there is a positive and statistically significant correlation between the final acquisition price and VIC ratios.
A correlation such as this shouldn’t come as a surprise. The vast majority of companies don’t raise more than a few tens of millions of dollars, and 99 percent of U.S. companies raise less than around $160 million, as Crunchbase News found last May.
So, for most companies, acquisition values over about $50 million are more likely to generate higher multiples. A well-known example would be a company like Nervana, which had raised approximately $24.4 million across three rounds, according to Crunchbase data. Nervana was then acquired by Intel in August 2016 for $350 million, producing a VIC ratio of around 14.34x.
Of course, the tendency for bigger exits to generate bigger returns is just a rough rule of thumb, and there are plenty of cases where big exits don’t correspond to big multiples. Here are two examples:
- Men’s razor delivery service Dollar Shave Club raised around $163.5 million from seed through Series D. It was acquired by Gillette’s parent company, Unilever, for $1 billion in cash in 2016. Although it was one of the biggest startup acquisitions by a consumer packaged goods company in several years, the transaction netted a middle-of-the-road 6.12 VIC.
- San Francisco-based fintech startup Earnest had raised $119.1 million in venture funding across five rounds before a $155 million all-cash buyout by Navient Corporation in October 2017. The deal delivered a modest 1.3 VIC ratio.
These latter two examples offer a convenient segue to the penultimate section. There, we’ll explore the relationship between how much money a startup raises, and its ratio of valuation to invested capital at time of exit.
Smaller war chests deliver bigger exits
Dollar Shave Club and Earnest are examples of companies that raised more than $100 million in funding but ended up delivering exits less than the vaunted 10x multiple that most venture investors seem to target. So is it the case that companies with less VC cash lining their pockets tend to deliver higher VIC multiples when they exit? The answer, in short, is yes.
In the chart below, you can find a plot of total equity funding measured against VIC ratios at exit, again using a logarithmic scale for the X and Y axes.
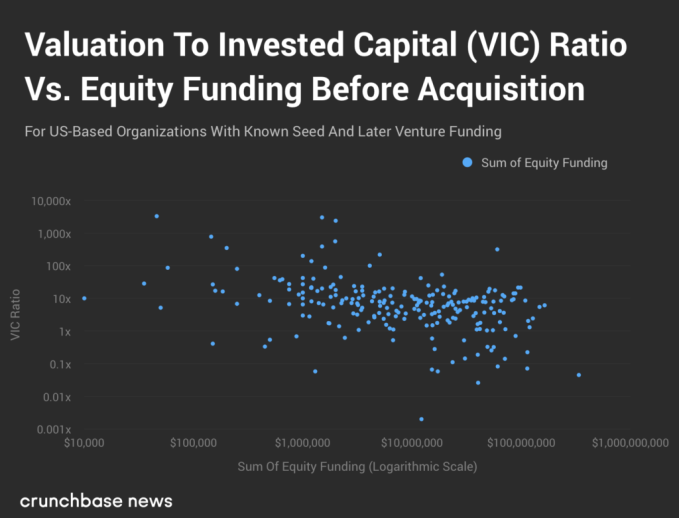
Out of our sample of 225 acquisitions, we find a slight but statistically significant negative correlation between the amount of equity funding a startup has raised and the final VIC ratio.
And here, too, the results shouldn’t be that surprising. After all, as we saw in earlier examples, a lot of venture funding can weigh down a company’s chances of getting a big exit. It’s easier for a startup with $1 million in venture funding to be acquired for $10 million than it is for a company with $100 million in VC backing to exit for $1 billion plus.
Of those companies that managed to raise a lot of money and generate an outsized VIC multiple, many of them are in the life sciences. Again, this isn’t surprising, considering that sectors like biotech, pharmaceuticals and medical devices are incredibly capital-intensive in the U.S. due to long trial periods and the high cost of regulatory compliance. Unlike the mobile sector, where a small amount of capital can go a long way, it usually takes a lot of money to create something of serious value in the life sciences.
Multiples matter, but most exits are still good exits
The goal of investing is to get more money out than you put in. This is true for investors ranging from pre-seed syndicates all the way up to massive sovereign wealth funds. If we want to characterize any exit with less than a 1.0 VIC ratio as “bad” and everything above 1.0 is “good,” then most of the exits in our data set, specifically 88 percent of them, are good. Of course, there’s some sampling and survivorship bias that probably leans in favor of the good side. But regardless, most companies will deliver more value than was put into them, assuming they can find the exit.
But assuming a company does find a buyer, we’ve found some factors correlated to higher VIC multiples. Bigger deals correspond to bigger multiples, and companies with less capital raised can often deliver bigger returns to investors.
So while venturing out, it’s always important to keep an eye on the exit.
Methodology: A dive into exit data
There are a number of places we could have started our analysis, and we opted for a fairly conservative approach. Using data from Crunchbase, we started with the set of all U.S.-based companies founded between 2003 and today. (This is what Crunchbase News has been calling “the Unicorn Era,” in homage to Aileen Lee’s original definition for the new breed of billion-dollar private companies.)
To ensure that we’re working with the fullest-possible funding record, we filtered out all companies that didn’t raise funds at the “seed or angel stage.” We further filtered out companies that have missing round data. (For example, having a known Series A round, a known Series C round, but missing any record of a Series B round.) Startups that raised equity funding rounds with no dollar-volume figure associated with it were also excluded.
We finally merged this set of companies with Crunchbase’s acquisition data to ultimately produce a table of acquired companies, the amount of equity funding they raised prior to acquisition, the name of the company that bought the startup and the amount of money paid in the deal. Again, by starting with acquired companies for which Crunchbase has relatively complete funding records, the resulting set of 225 M&A events, while small, is more likely to produce a more robust and defensible set of findings.
Illustration: Li-Anne Dias