
Liquidity is a crucial metric for all marketplaces. But how can we truly evaluate this liquidity? The three keys to answering this question are density, appropriately balanced demand and supply and category concentration.
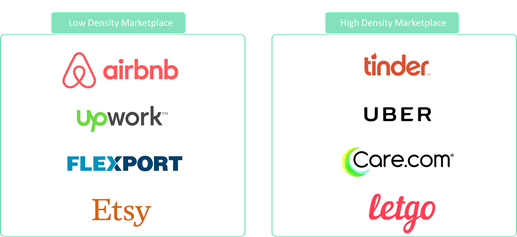
Density, geographic reach and distance between counterparts
The first step to analyzing the potential liquidity of a marketplace is understanding its geographic extent. For example, Upwork will see transactions filled between freelancers and employers all around the globe, while Tinder will (typically) only see two people dating within the same city. Tinder would therefore require a city per city launch and a city per city liquidity analysis.
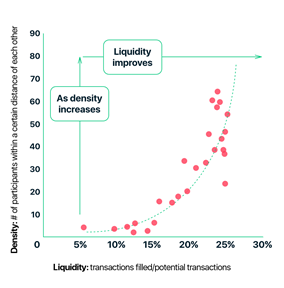
In local marketplaces, there is a strong correlation between density and liquidity. The higher the number of participants within a relevant radius, the higher the liquidity of the marketplace. We define liquidity as the number of transactions filled out of the total potential transactions in a marketplace. We refer to density as the number of participants within a certain geographic area.
Let’s use Tinder as an example. If in a given week Tinder acquires 1,000 female participants in Chicago and 1,000 male participants in New York, Tinder’s number of total users increases, but its liquidity remains the same. Now, if Tinder acquires 1,000 female participants and 1,000 male participants all located in the borough of Brooklyn, this higher density of users (from both sides of the marketplace) will lead to higher liquidity.
To determine the density in a marketplace, you need to first define the limits of the geographic area within which its transactions can be filled. This distance threshold (“r” in the visual below) is different for every marketplace and you will identify it by understanding how far your customers are willing to travel to complete their transaction. For example, a seller at Letgo might not be willing to travel 30 minutes to sell a used skateboard for $30, but a babysitter at Care.com will likely travel 30 minutes to make $150 for a day of babysitting.

Once you define this distance threshold “r” you need to maximize density. But how?
You start by optimizing your marketing strategy to achieve the highest customer acquisition within the established distance threshold. As a result, you will maximize the active participants within that distance of each other, and therefore maximize density, moving from the low-density to the high-density marketplace diagram above.
The evolution of a balanced marketplace
Maintaining the optimal balance of demand and supply in a marketplace is crucial to achieve liquidity. If a marketplace doesn’t have the right number of buyers per listing, or the right number of items listed per buyer, transactions will go unfilled.
How can we analyze what is the right balance of demand and supply? By looking at several ratios:
- The average number of buyers relative to the number of sellers needed to fill a transaction
- The number of bids per buyer required to fill a transaction
- The average of items listed per seller required to fill a transaction
Let’s base our example on a used furniture marketplace in which the average ratio of bids per item listed required to fill a transaction is 100 to 1. So, every item listed needs 100 bids for it to sell. Now the conversion from this ratio to the ratio of buyers to sellers is determined by the average number of bids per buyer and the average number of items each seller is selling. This is the key to the analysis.
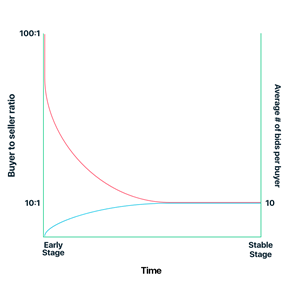
For simplicity, let’s assume the average items posted per seller is 1 and the average bids per buyer is 10. This means that the ratio of buyers to sellers is 10:1; it requires 10 buyers for every seller, to fill a transaction. However, it usually takes time for the average number of bids per buyer to be this high, and it will only happen once the company has reached a stable stage of liquidity.
At an early stage, the likely scenario is that the average number of bids per buyer is 1 or less, which means the ratio of buyers to sellers initially is more like 100:1. So, it requires 100 buyers for every seller to fill a transaction. The ratio of buyers to sell would evolve like this:
The first reason why average bids per buyer increase over time is that when a new buyer experiences a marketplace for the first time, they are hesitant to bid. The buyer needs to trust the marketplace before being ready to make a committing bid. Trust takes time. Furthermore, at a stable stage the diversity of inventory in the marketplace will increase the likelihood that a buyer will find something that interests them.
However, the conclusion here is not just that the bids per buyer increase over time and that this determines the evolution of a balanced marketplace. It is that you need to closely monitor the second-degree KPIs (like bids per buyer and listings per seller) to understand how to adjust your strategies to maintain a balanced marketplace over time. In the same way that it is common for average bids per buyer to increase over time, it also is usual that the average items listed per seller change over time.
Category concentration and diminishing marginal returns
Once you have defined the distance threshold under which your marketplace will fill transactions, you need to breakdown the liquidity per category within the marketplace. For example, if our used furniture marketplace has 1 million active buyers at a certain point in time, how many of them are in the market for a table? How many are looking for chairs? How many want a couch? Only a small segment of the 1 million active buyers will be interested in each category. This means you cannot just evaluate the overall liquidity of the marketplace, you need to do it on a per-category basis.
It is often the case that most participants are interested in just a few of the categories served by the marketplace. This means that as you spend marketing dollars to acquire users, the higher-concentration categories will yield liquidity faster than the rest. And in most cases, the low-concentration categories will require a much larger marketing investment to achieve liquidity.
Let’s go back to our furniture marketplace example to illustrate this point with the following assumptions:
- 50 percent of the buyers are interested in buying a couch while the other 50 percent are equally scattered across 50 other furniture categories
- We are spending $100 on marketing
- Our CAC is $1
- The liquidity threshold per category is 50 buyers (the liquidity threshold is the number of buyers needed for a transaction to fill)
We would have 50 new buyers in the couch category, and one new buyer in each of the other 50 categories. The 50 new buyers in the couch category will substantially increase the likelihood of a filled transaction within its category, while the additional one participant in any of the remaining categories barely increases its chances to fill a transaction in their respective areas.
If we take this example to scale and we assume:
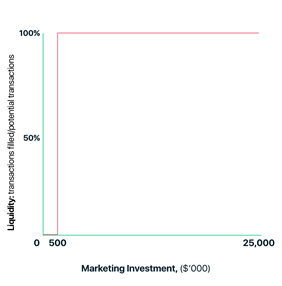
- Marketing budget of $500,000
- A liquidity threshold per category of 250,000 participants
Only the couch category would reach liquidity. And even if we were to invest $1 million in marketing, only the couch category would reach liquidity because all the other areas would only reach 10,000 participants each. And the same would happen until the invested amount goes above $25 million. This means that such a marketing strategy would lead to diminishing marginal returns from a liquidity standpoint:
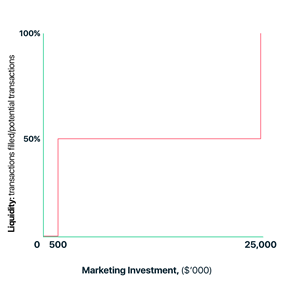
Again, the best way to solve this issue is to align the marketing strategy to the category concentration. In other words, allocate the majority of the marketing investment to the most predominant category (which in our example would be the couch category). The liquidity chart in that case would look like this:
This is, of course, an extreme example.
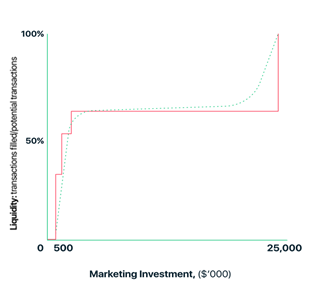
A more realistic case would have several concentrated categories and a long tail of dozens of others. To illustrate this, let’s assume 30 percent of the buyers want to buy a couch, 20 percent a chair, 10 percent a table and the remaining 40 percent are scattered across the 40 other outstanding categories. This time, the liquidity chart would look like this (which is more realistic):
Density, a balanced demand and supply and category concentration are crucial drivers of marketplace liquidity. To maximize your return on marketing investment, you need to align your marketing and liquidity strategies. To monitor the evolution of your liquidity, you need to track your second-degree KPIs.
VCs should also dig into these three principles when evaluating a marketplace investment opportunity.