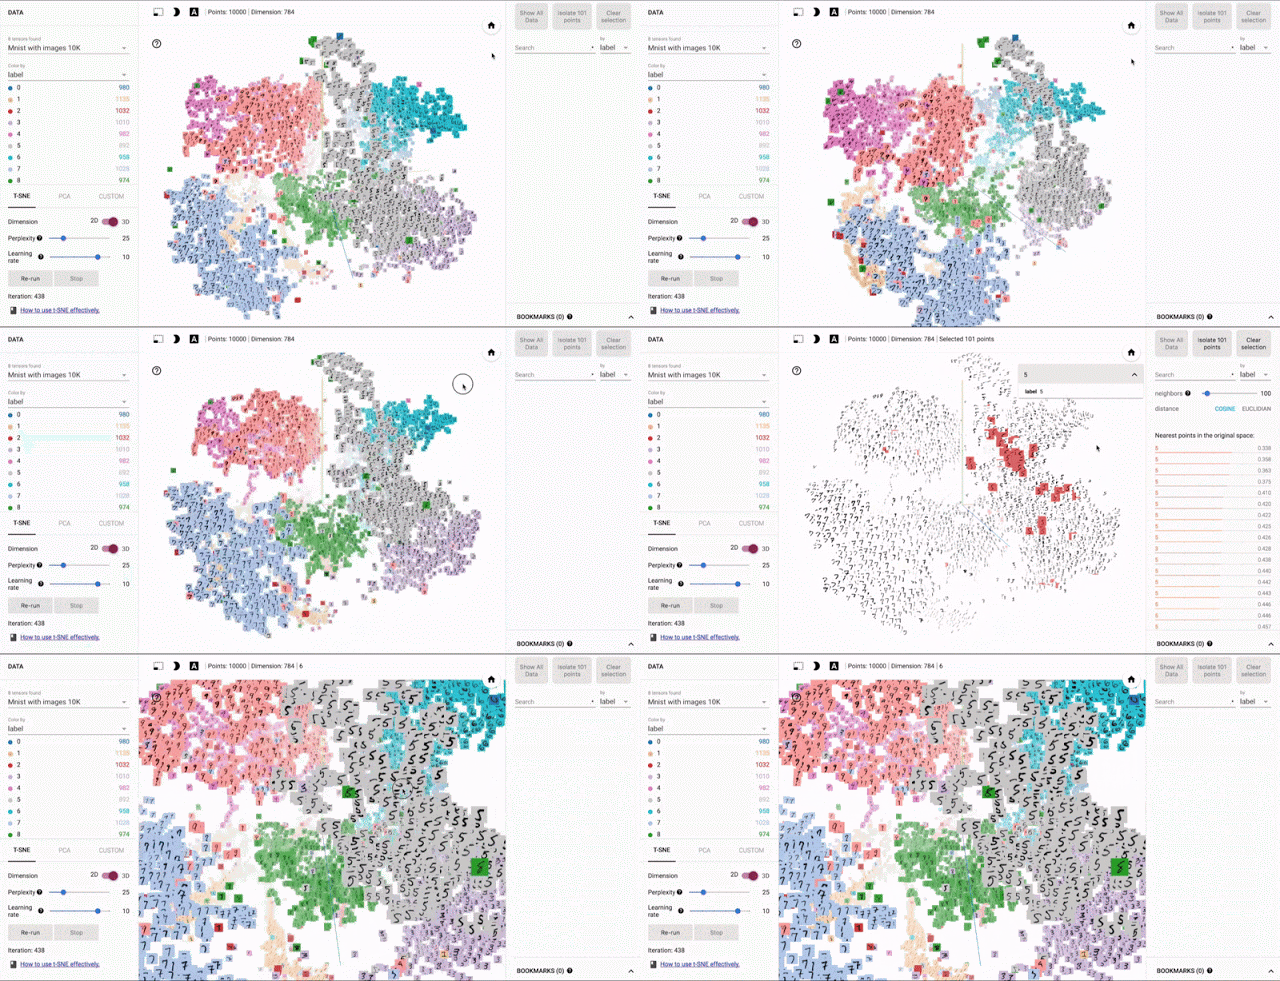
This morning, Google announced that it was open sourcing its data visualization tool, Embedding Projector. The tool will help machine learning researchers to visualize data without having to install and run TensorFlow.
Dimensionality, and vectors in general, is not something that most of us find easy to understand. The problem is that we all live in a three-dimensional world. We are taught length, width and height, so we struggle to imagine what a forth, fifth or sixth dimension might look like — this is why most of us found Christopher Nolan’s representation of additional dimensions wonky in the movie Interstellar.
Instead of thinking about dimensionality of the world as we know it, try to just think purely about data. If I asked you to compare two houses, you might start by making a list of criteria that differentiate the houses. This list could include color, size, roof style and yard shape. This model could be considered a four-dimensional model.
You could choose to visualize this data in a table, or you could try to represent it as a picture. To get there, you would have to use vectors. For a simple four dimensional model of two houses, you could actually create a chart in PowerPoint using traditional X and Y axis measurements in addition to features like bubble size and bubble color.
For a significantly more complex model with thousands of dimensions, traditional tools start to break down. That’s where Google’s Embedding Projector comes in.

If you have ever used Spotify’s Discover Weekly, you have run head on into embeddings, you just didn’t know it. At the advanced machine learning level, vector mappings can represent the attributes of songs. Mapping an entire collection of music against the preferences of an individual listener enables users to get personalized, accurate, music recommendations — something that just would not work in PowerPoint.
