Words come and go, and now thanks to a new Google database of 500 billion words in 5.2 million books, you can chart the popularity of words in literature and other books going back hundreds of years. The database is can be accessed by scholars or anyone through a Google Labs project called the Google Books Ngram Viewer. You type in a word, and it charts the usage of that word over time.
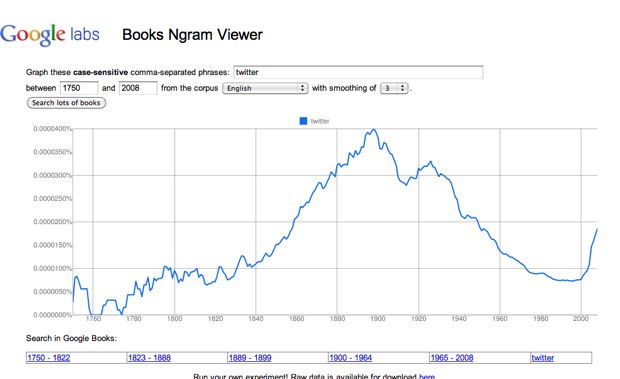
Naturally, I typed in “twitter”, to see how that word has come in and out of vogue. The result is in the chart above, which shows the word gaining popularity from 1750 and peaking a little over a century ago around 1900. Then the word went into along decline until this decade when it started to shoot up again. The graph above is smoothed over, it doesn’t really start to take off until 2006 (see unsmoothed graph) when Twitter was founded, and the word took on an entirely new meaning. Strangely, though, there was an uptick starting even before that around 2003. Maybe Jack Dorsey read it somewhere and it stuck in his mind.
The Ngram Viewer is case-sensitive. So if you do a search for “Twitter” proper, it shoots up even higher. For some reason the data only goes to 2008, so imagine what the chart would look like if it went all the way to today. These searches are across all English-language books in the database, but you can also narrow it down to just English fiction or different languages. The charts are broken up into different time periods, which you can click on to get book search results containing the word you are graphing.
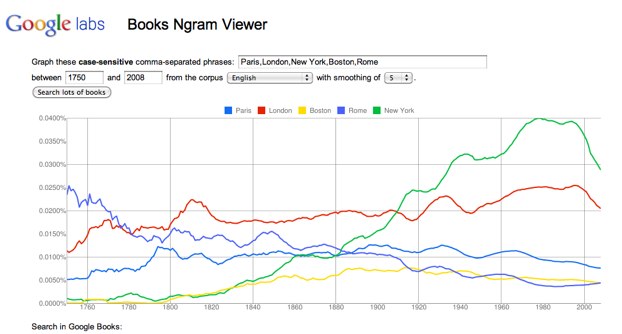
Speaking of the rise and fall of words, they can also tell us something about the relative importance of different centers of power in the public imagination. Do a search for “Paris, London, New York, Boston, and Rome,” for instance, and you can see when interest peaked and started to taper off for each one. Yeah, things don’t look so good for America (as represented by New York City).