Successful startups invest heavily in growth. They have to hire the right people, buy equipment or software, and maybe even pay for excess server capacity to keep a product or service from crashing. Growth isn’t cheap—and that spending fuels the venture capital and startup industry.
VCs identify startups that have potential and invest in them, and startups turn around and pour that money into growth. Each startup is wildly different, especially when it comes to spending. As a result, it can be hard to find spending comparisons to understand if you’re doing it “right.”
We analyzed Brex data to help provide that kind of benchmark. Brex companies consist primarily of early to mid-stage startups whose stages we have classified by specific amounts of funding. As such, we’ve sought to calculate how much money the typical startup is investing in its growth.
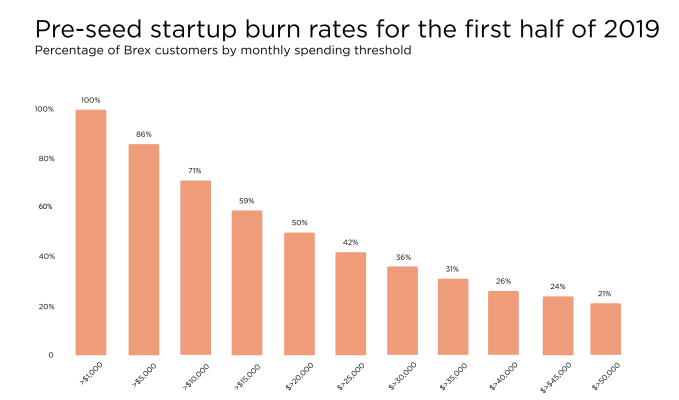
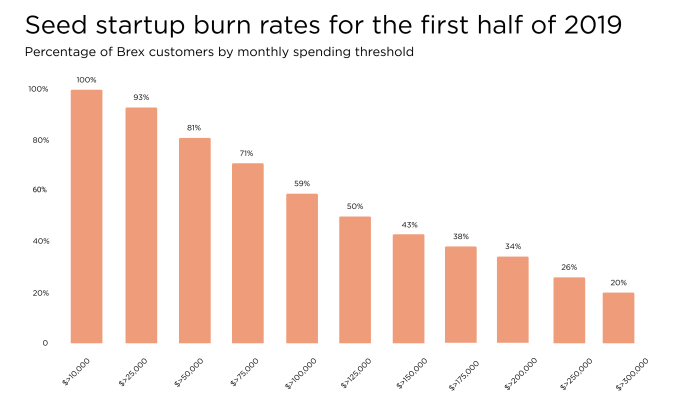
The burn rates make more sense when considering the progress of a company at a certain funding stage. Pre-seed startups are investing in building the first version of their product, so their costs may involve more groundwork and getting an initial team together. Seed-stage startups may have already launched and need to start their first advertising campaigns.
Companies at the seed stage certainly have a scaling mentality, which can mean a lot of different things for a lot of different people. But at that point investors have enough confidence to invest substantially more capitaland enable further growth.
The cost of growing
The idea of a “pre-seed” startup isn’t necessarily a new one. But the massive growth of the angel investment community, powered by strong network effects and products like AngelList, has led to an abundance of capital for founders with great ideas.

We found the median spending rate for pre-seed Brex customers remained mostly unchanged between the first and second quarter this year. Investors poured $1.6 billion into more than 1,800 seed and angel investments in the U.S. and Canada in the second quarter of 2019, according to Crunchbase. While this represents a slight year-over-year dip, it’s also a significant uptick from the $1.33 billion invested in the first quarter of the year.
Seed-stage startups are typically at the stage where they are looking for product-market fit. At that stage, customer acquisition is a vital part of growth. That means startup growth for seed startups revolves around customer interest—and seasonality may be critical factor in determining startup burn rate. We found that seed-stage Brex customers burn rates increased slightly between Q1 and Q2.

Brex customers who have raised a series A round also saw a slight increase in burn quarter-over-quarter. At this stage, companies are at the point where they’re typically investing heavily in growth. Series A startups are likely at the stage where they have to invest in a lot of different functions. They may be ramping up hiring, paying for more ads to acquire customers, or upgrading products to account for a larger customer base.
We found that the burn rates across among the top-spending regions were not substantially different, though Boston was a clear leader. But the types of companies that populate these regions may also differ. For example, Boston is a region with a high concentration of biotechnology and life sciences startups, while New York has a high concentration of financial technology startups.
Here’s how the ranking breaks down among some of our markets:
- Boston
- San Francisco
- Greater SF Bay Area
- Los Angeles
- New York
- Seattle
- San Diego
- Austin
The top expenses for startups
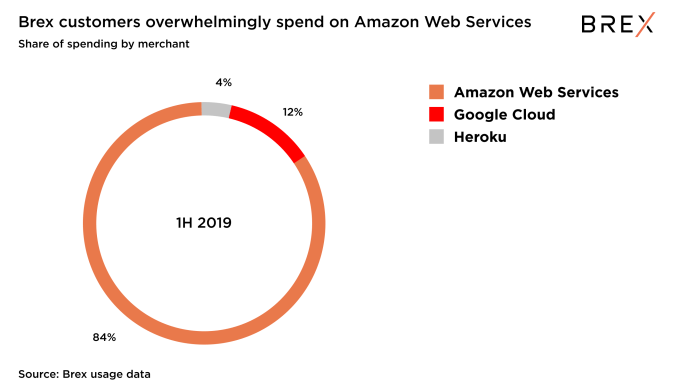
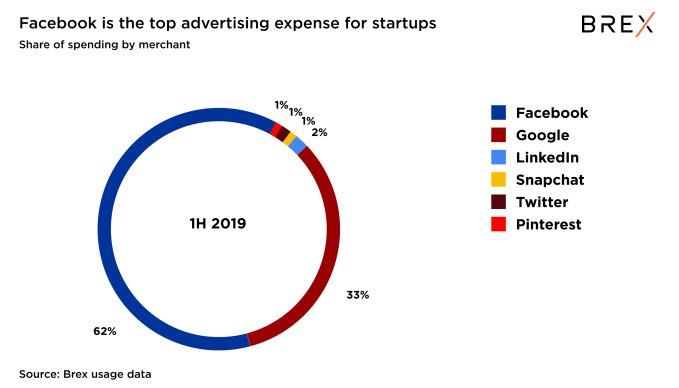
Two of the biggest investments for startups should seem pretty obvious: cloud computing to run their services; and advertising to make sure they get in front of the audience they need. We found that more than 10% of all Brex startup customer spend goes toward cloud services, and nearly 20% of that spend goes toward advertising and marketing. And in those expenses, there are two clear winners: Amazon and Facebook.
You’ll be hard-pressed to find a startup that doesn’t use, or at least got started on, Amazon Web Services. Amazon Web Services accounted for 84% of Brex customer spending on servers in the first half of the year. After all, Amazon Web Services dramatically lowered the barrier for startups to get their services up and running.

Meanwhile, Facebook accounted for 62% of all Brex customer spending. Pinterest, LinkedIn, and others still only occupy a small amount of advertising spend for Brex customers. It’ll be an uphill battle against Facebook and Google for those long-tail platforms, too. Facebook and Google are known entities where advertisers generally know what they’re getting when the insert a dollar into those acquisition machines.

Keeping things in perspective
While these may provide some helpful benchmarks to understand burn rates across multiple stages and regions, every startup is going to be different. One startup’s burn rate deviating from the median burn rate of a particular stage isn’t necessarily a bad thing. Hardware startups might burn more capital each month than your typical SaaS startup. It also isn’t necessarily indicative of an unhealthy business—it may actually be the contrary. Business models and spending requirements can differ radically.