Retention isn’t a silver bullet, but in SaaS, it’s the closest thing to it.
High retention indicates strong product-market fit. It is proof that you are solving a real problem and are adding value to your customers.
High retention also means better growth. Companies with best-in-class retention grow at least 1.5x-3x faster.
Finally, high retention means a more capital-efficient business. In SaaS, acquiring customers is the most costly part of running your business. Even at scale, sales and marketing expenses make up the majority of your expenditure. If you are unable to retain these expensive-to-get customers, your business is going to be less efficient and cost more to scale.
It’s no surprise, given all this, that companies with higher net revenue retention often command higher valuations.
How can companies know if their retention rate is up to par? And with the recent market downturn, is retention lower than it used to be?
There’s no better way to answer that than to look at real data. At ChartMogul, we studied more than 2,100 SaaS businesses to bring retention benchmarks and trends to the SaaS community. Here are our key takeaways.
Retention in 2022 was harder than ever
More than half of SaaS businesses had lower retention in 2022 when compared to 2021. A challenging macroeconomic environment meant subscribers reassessed and cut their SaaS spend. This is in sharp contrast to 2021, which saw almost 70% of businesses having a higher retention rate in 2021 when compared to 2020.
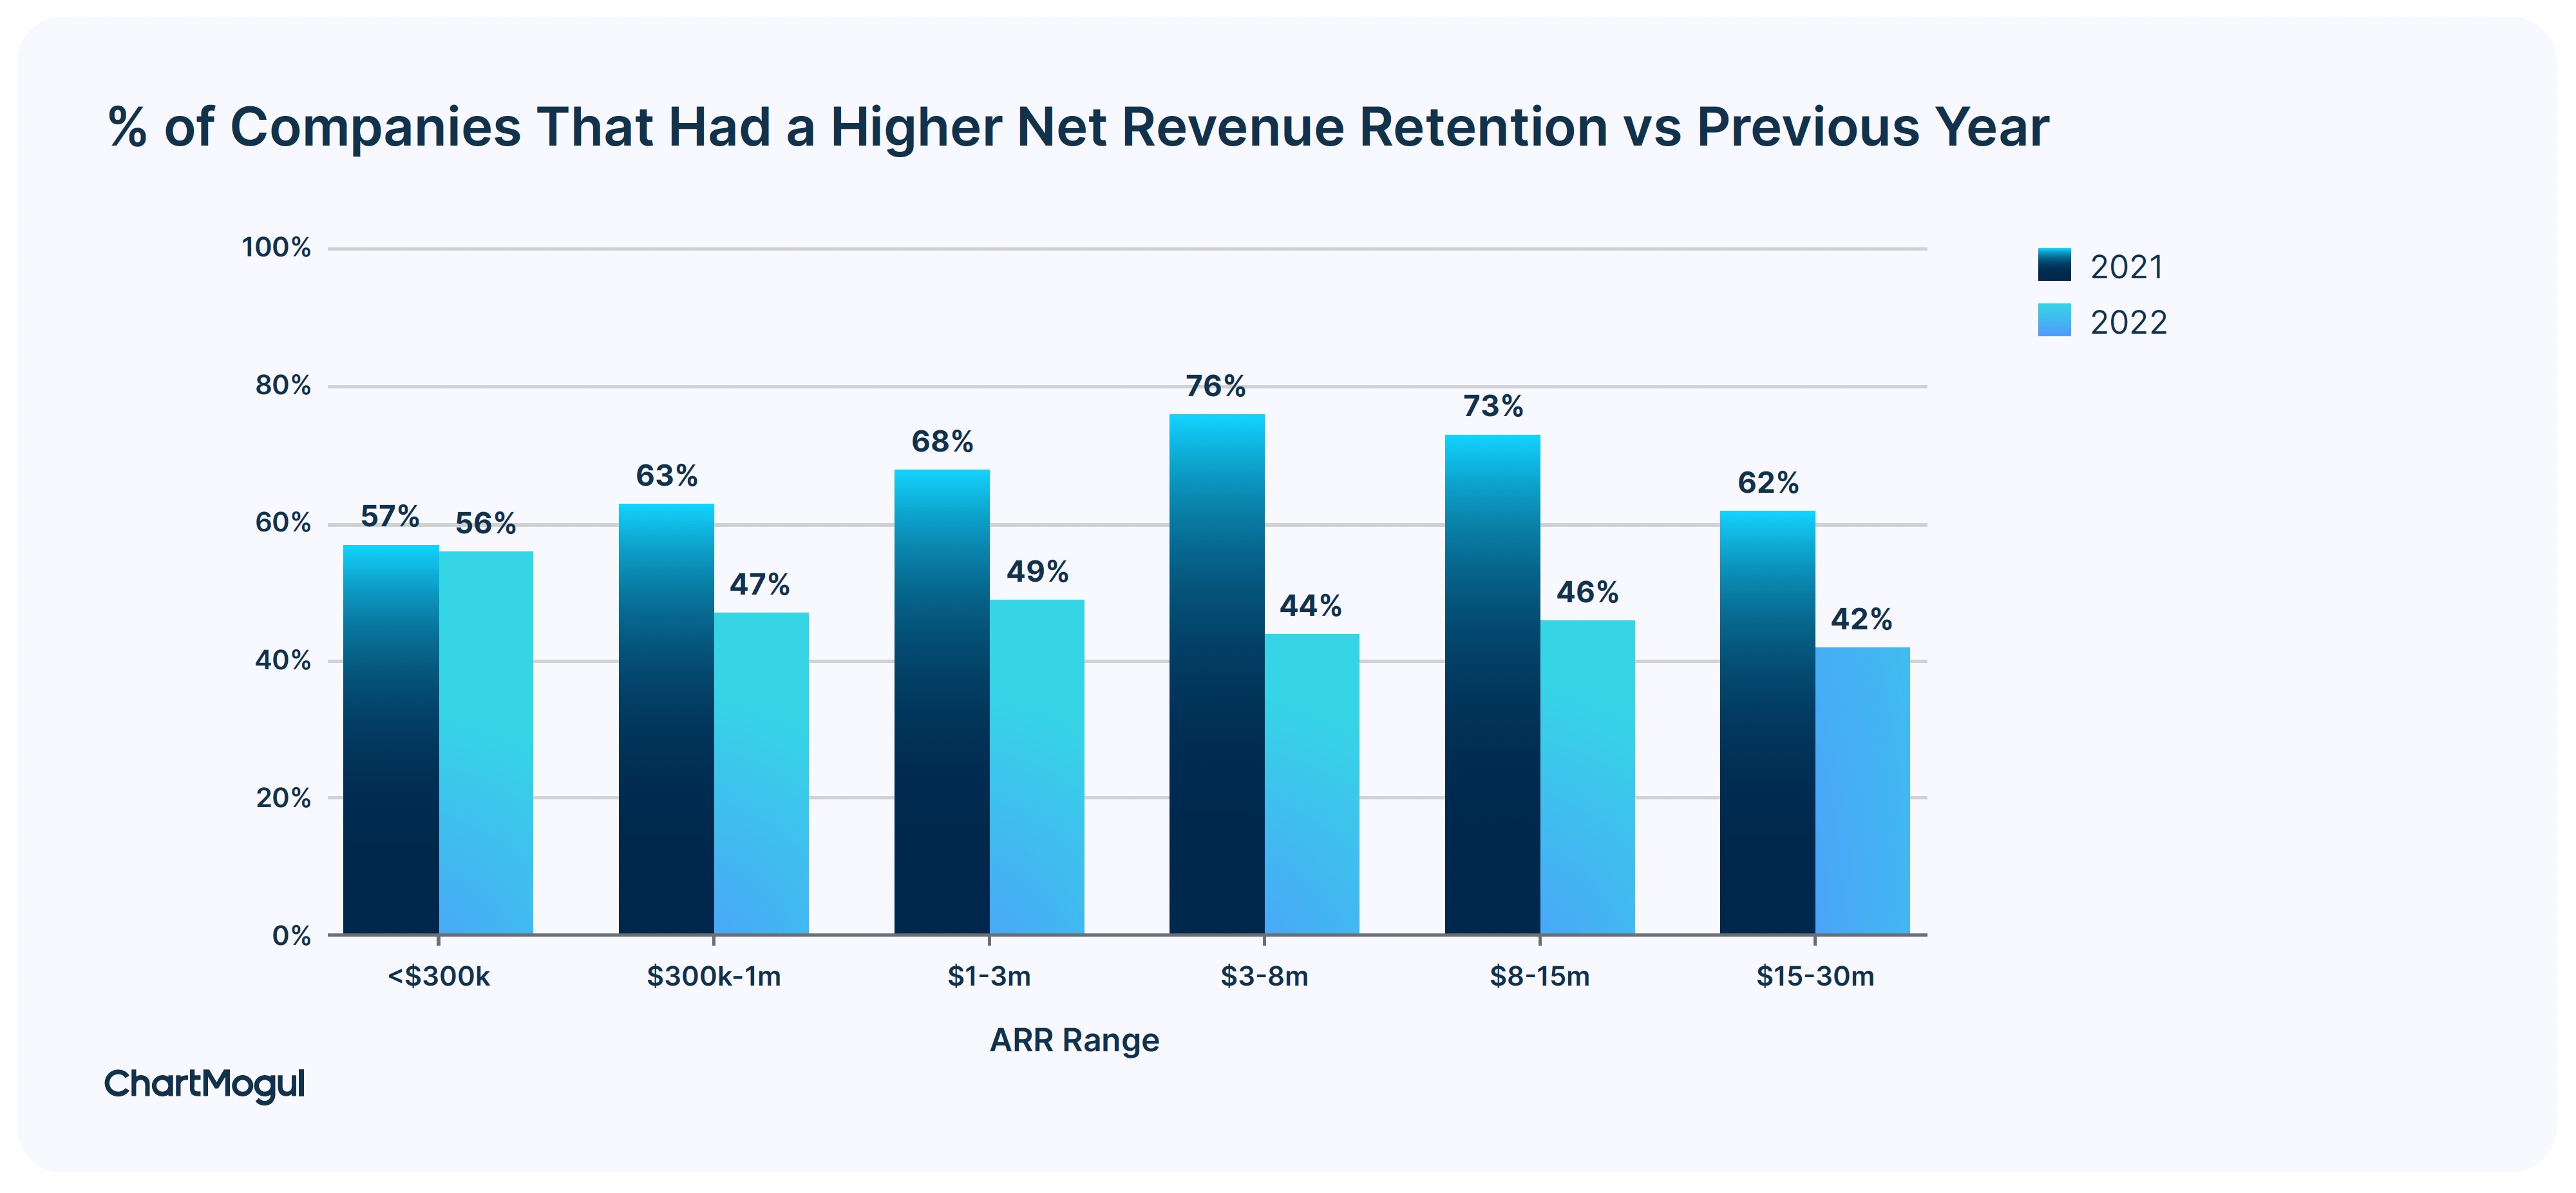
Percentage of companies that had a higher net revenue retention vs. previous year. Image Credits: ChartMogul
This trend of retention being lower in 2022 vs. 2021 is not unique to SaaS startups. SaaS behemoths like Snowflake also saw their retention come down from the highs of 2021.
SaaS businesses over $3m in ARR should target a net retention rate of over 100%
What is considered a good net retention rate differs by the stage of your business.
In the pre-product-market-fit stage of the business, net retention is usually poor. As startups grow and find product-market fit, net retention improves. Finally, as companies reach scale and become category leaders, net retention often goes over 100%.
When benchmarking, always keep the stage of your business in mind. Businesses with ARR in the range of $1 million-$3 million have a top quartile net retention rate of 94%. Those in the $3 million-$15 million ARR segment have a top quartile net retention rate of 99%. Businesses at scale with ARR in the range of $15 million-$30 million have a top quartile net retention rate of over 105%.
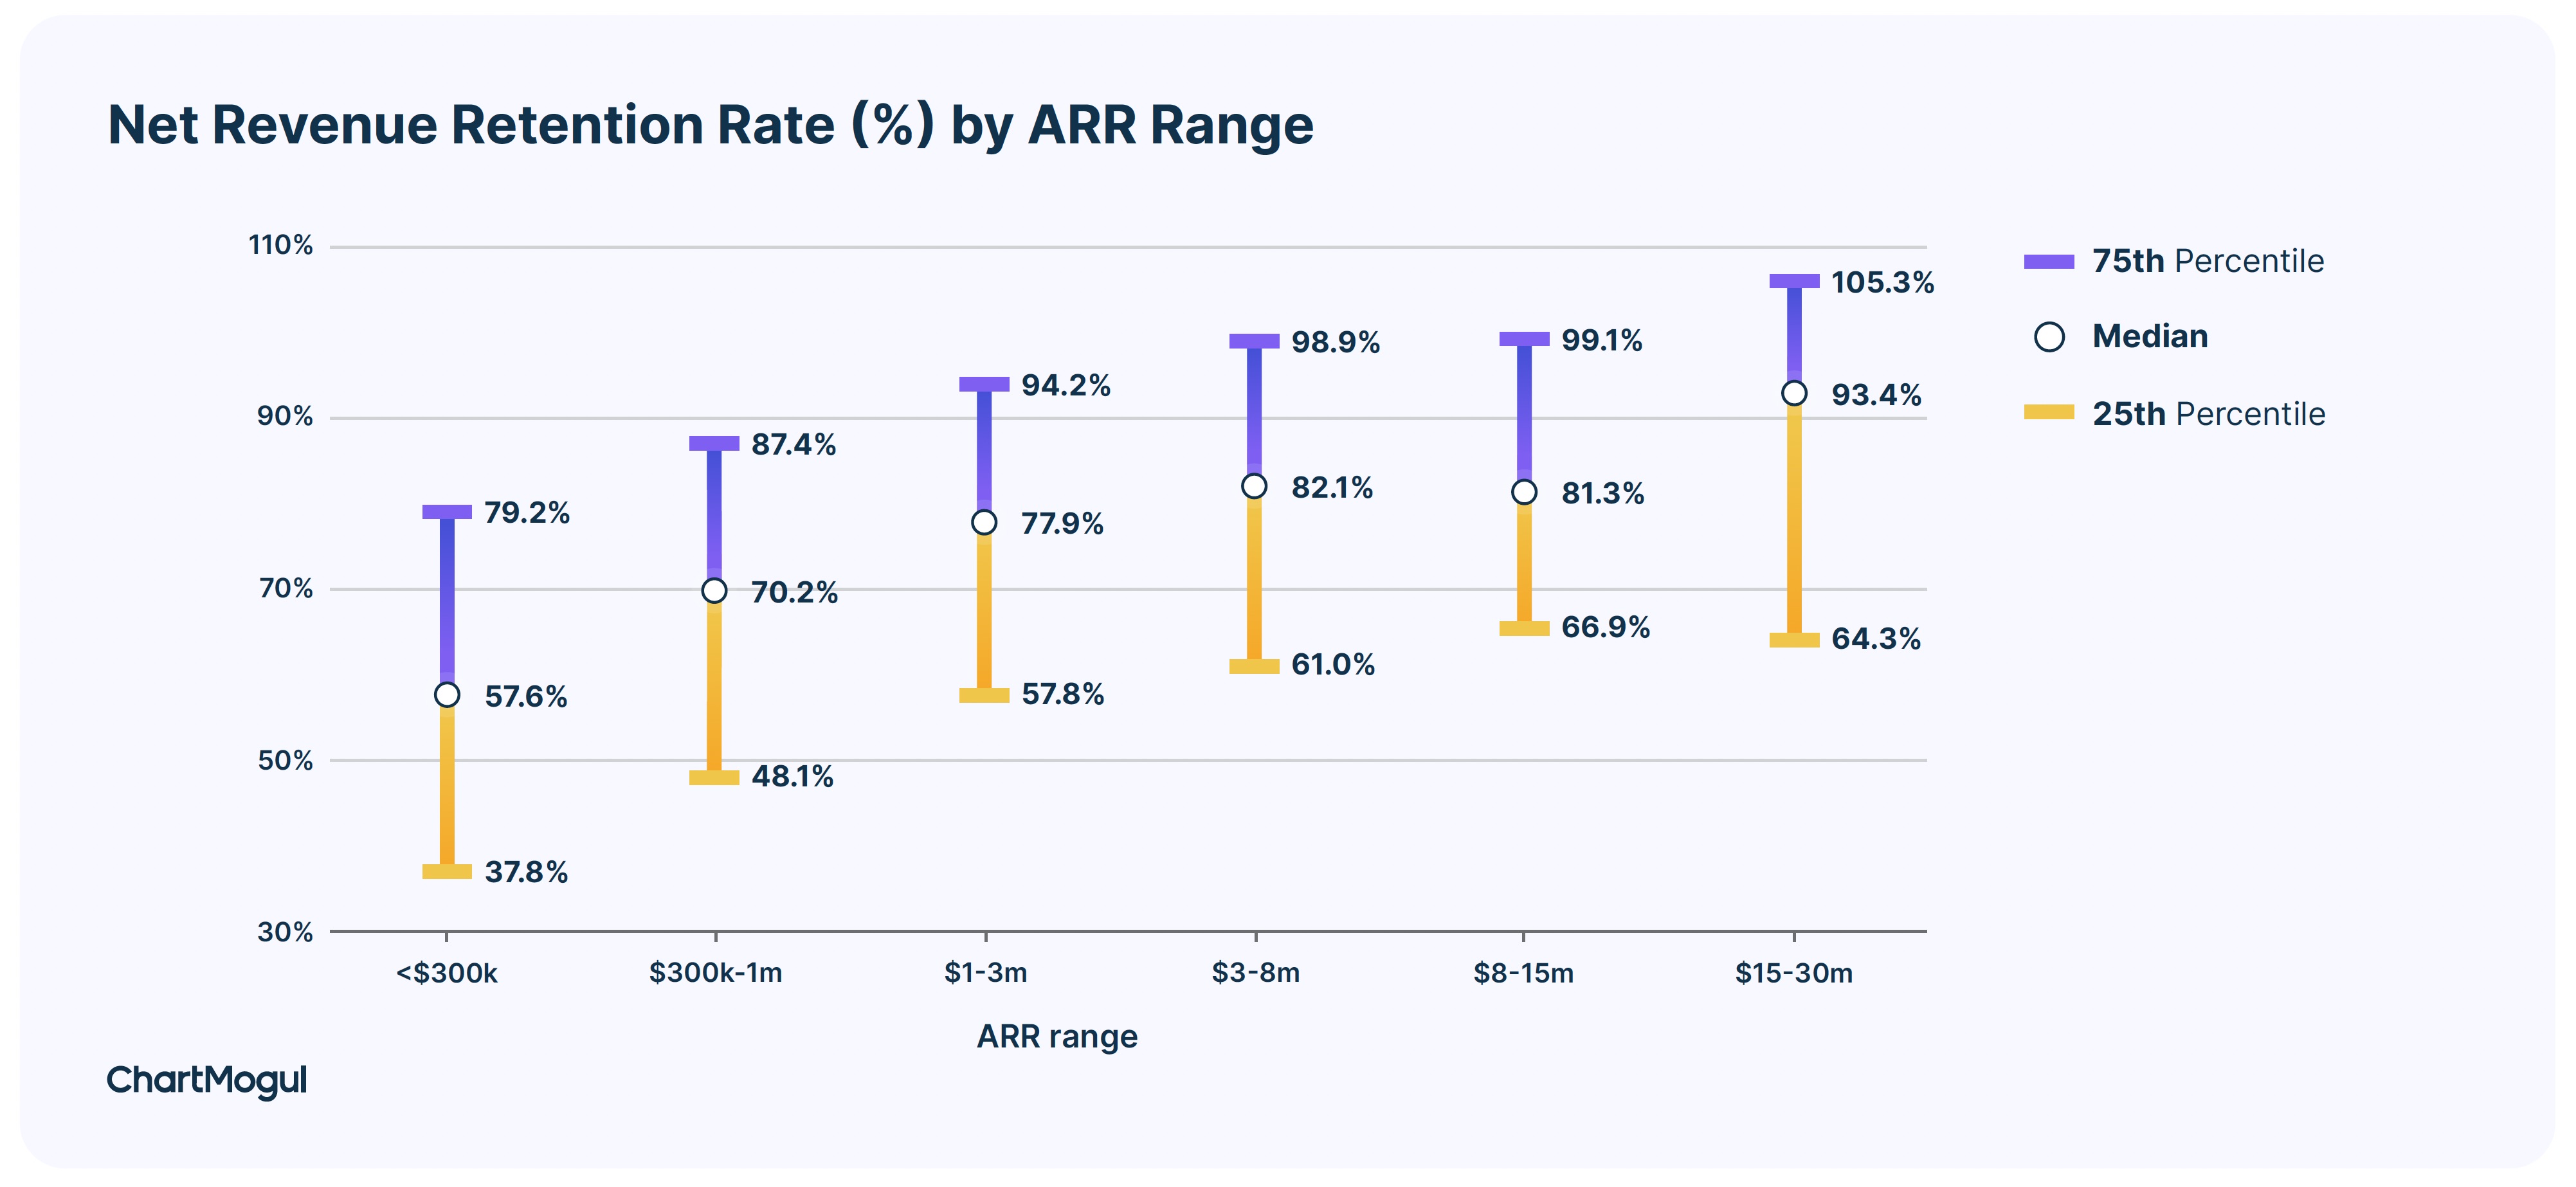
Net revenue retention rate (%) by ARR range. Image Credits: ChartMogul
A net retention rate of less than 100% means that your ARR decays, which means that you have less ARR today than a year ago from the same set of customers. A net retention rate of over 100% indicates strong product-market fit and showcases your ability to compound your revenue from your existing customer base.
Amongst higher ARR ranges, more businesses have a net retention rate over 100%. Just over 35% of SaaS businesses in the $15 million-$30 million ARR range have a net retention rate of over 100%.
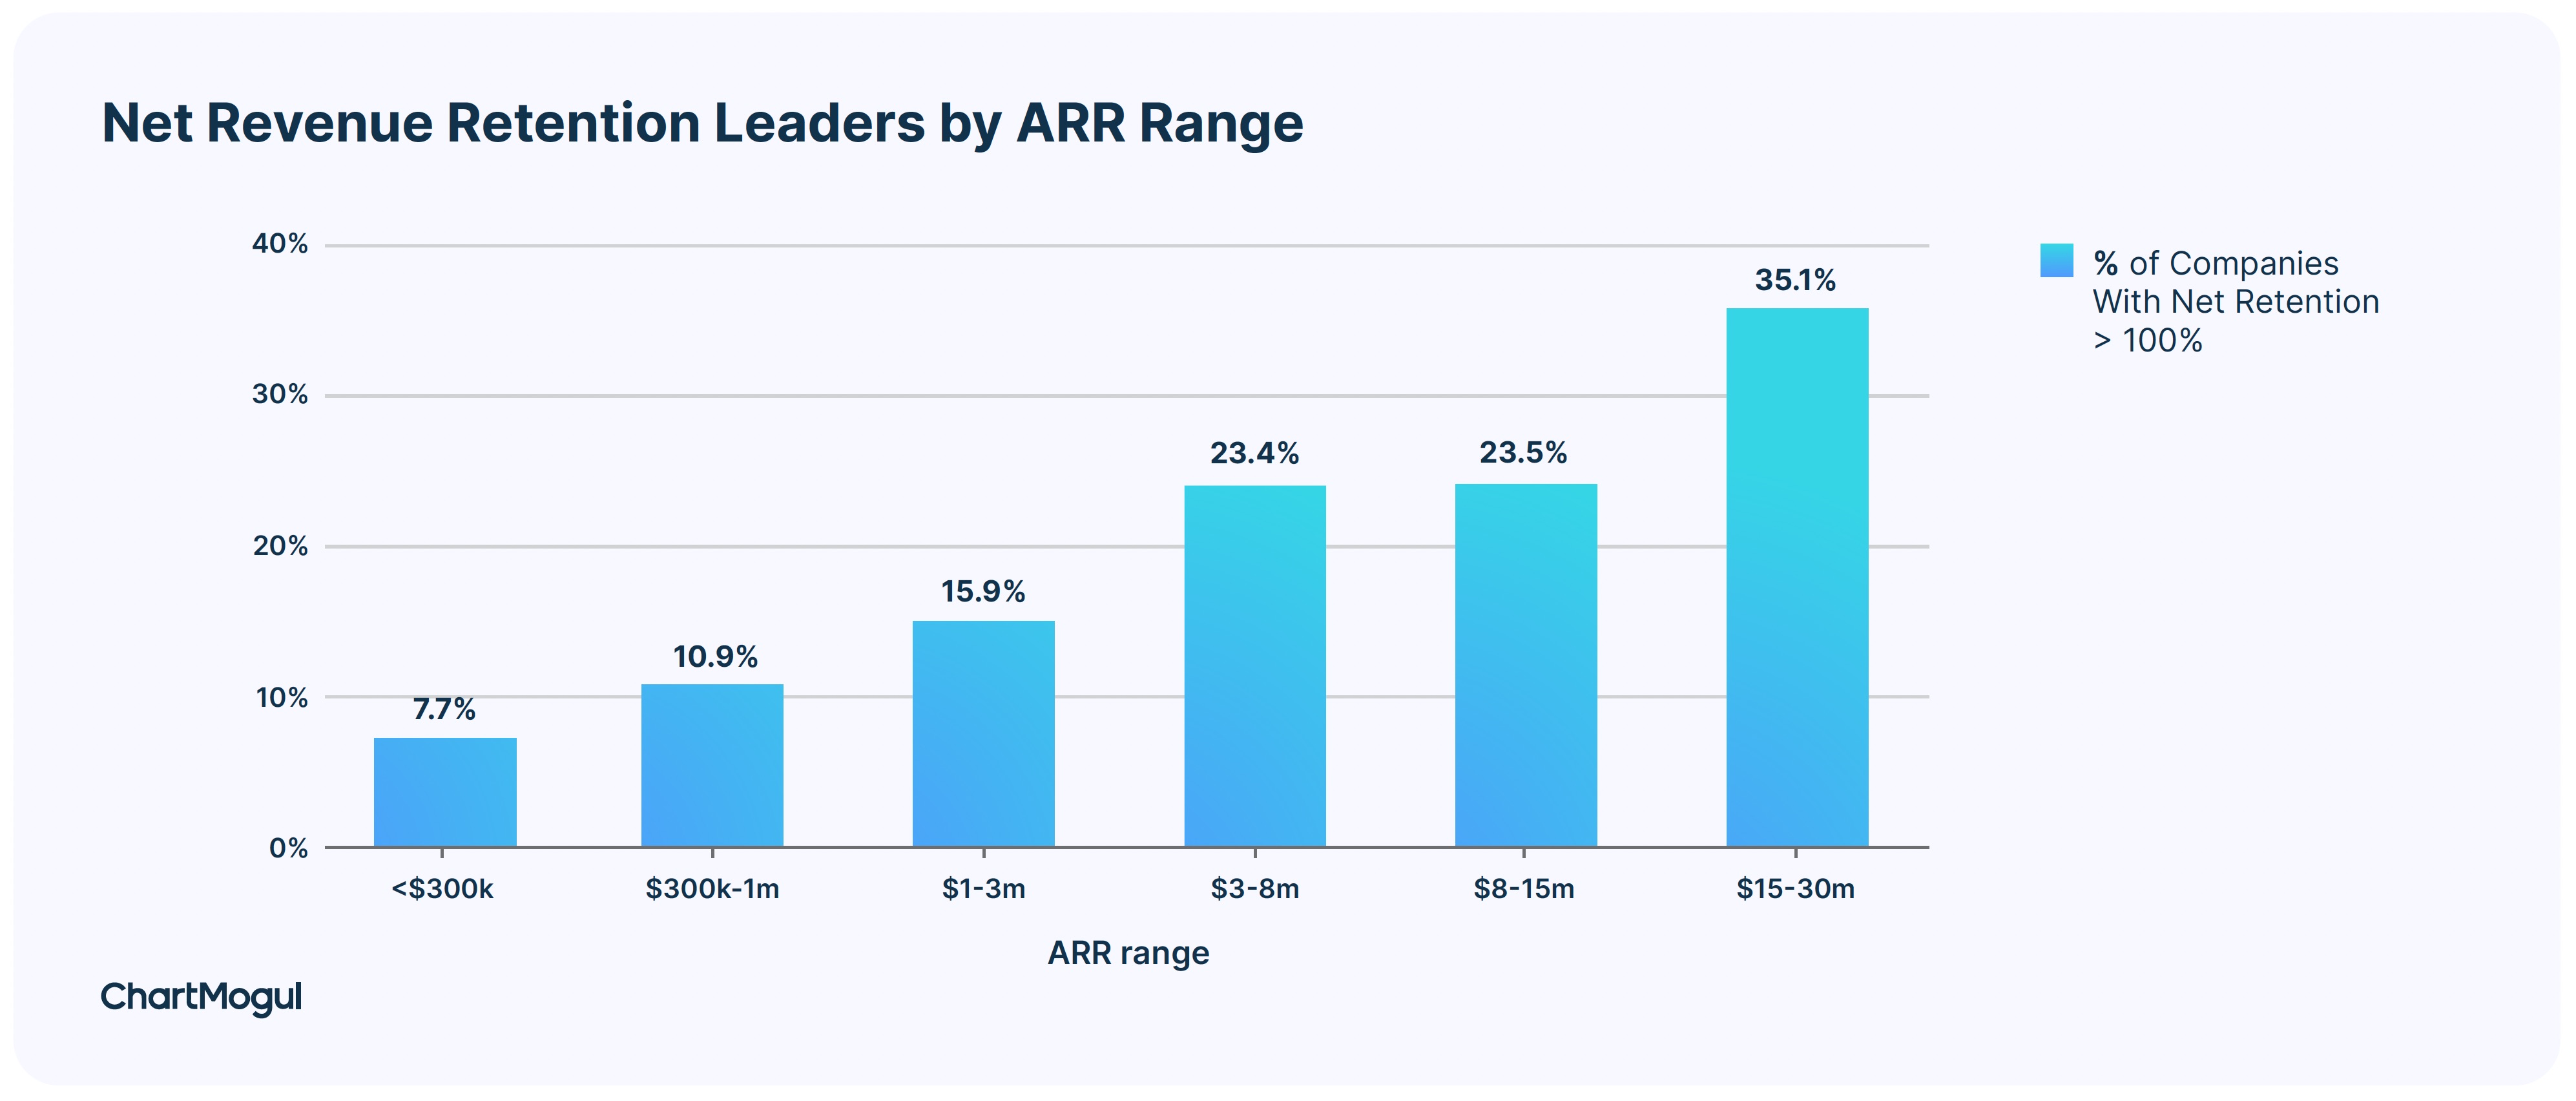
Net revenue retention leaders by ARR range. Image Credits: ChartMogul
Best-in-class net revenue retention is in the ~110%/120% range. Businesses with that high of a net retention rate usually have a combination of a high gross retention + strong expansion loop.
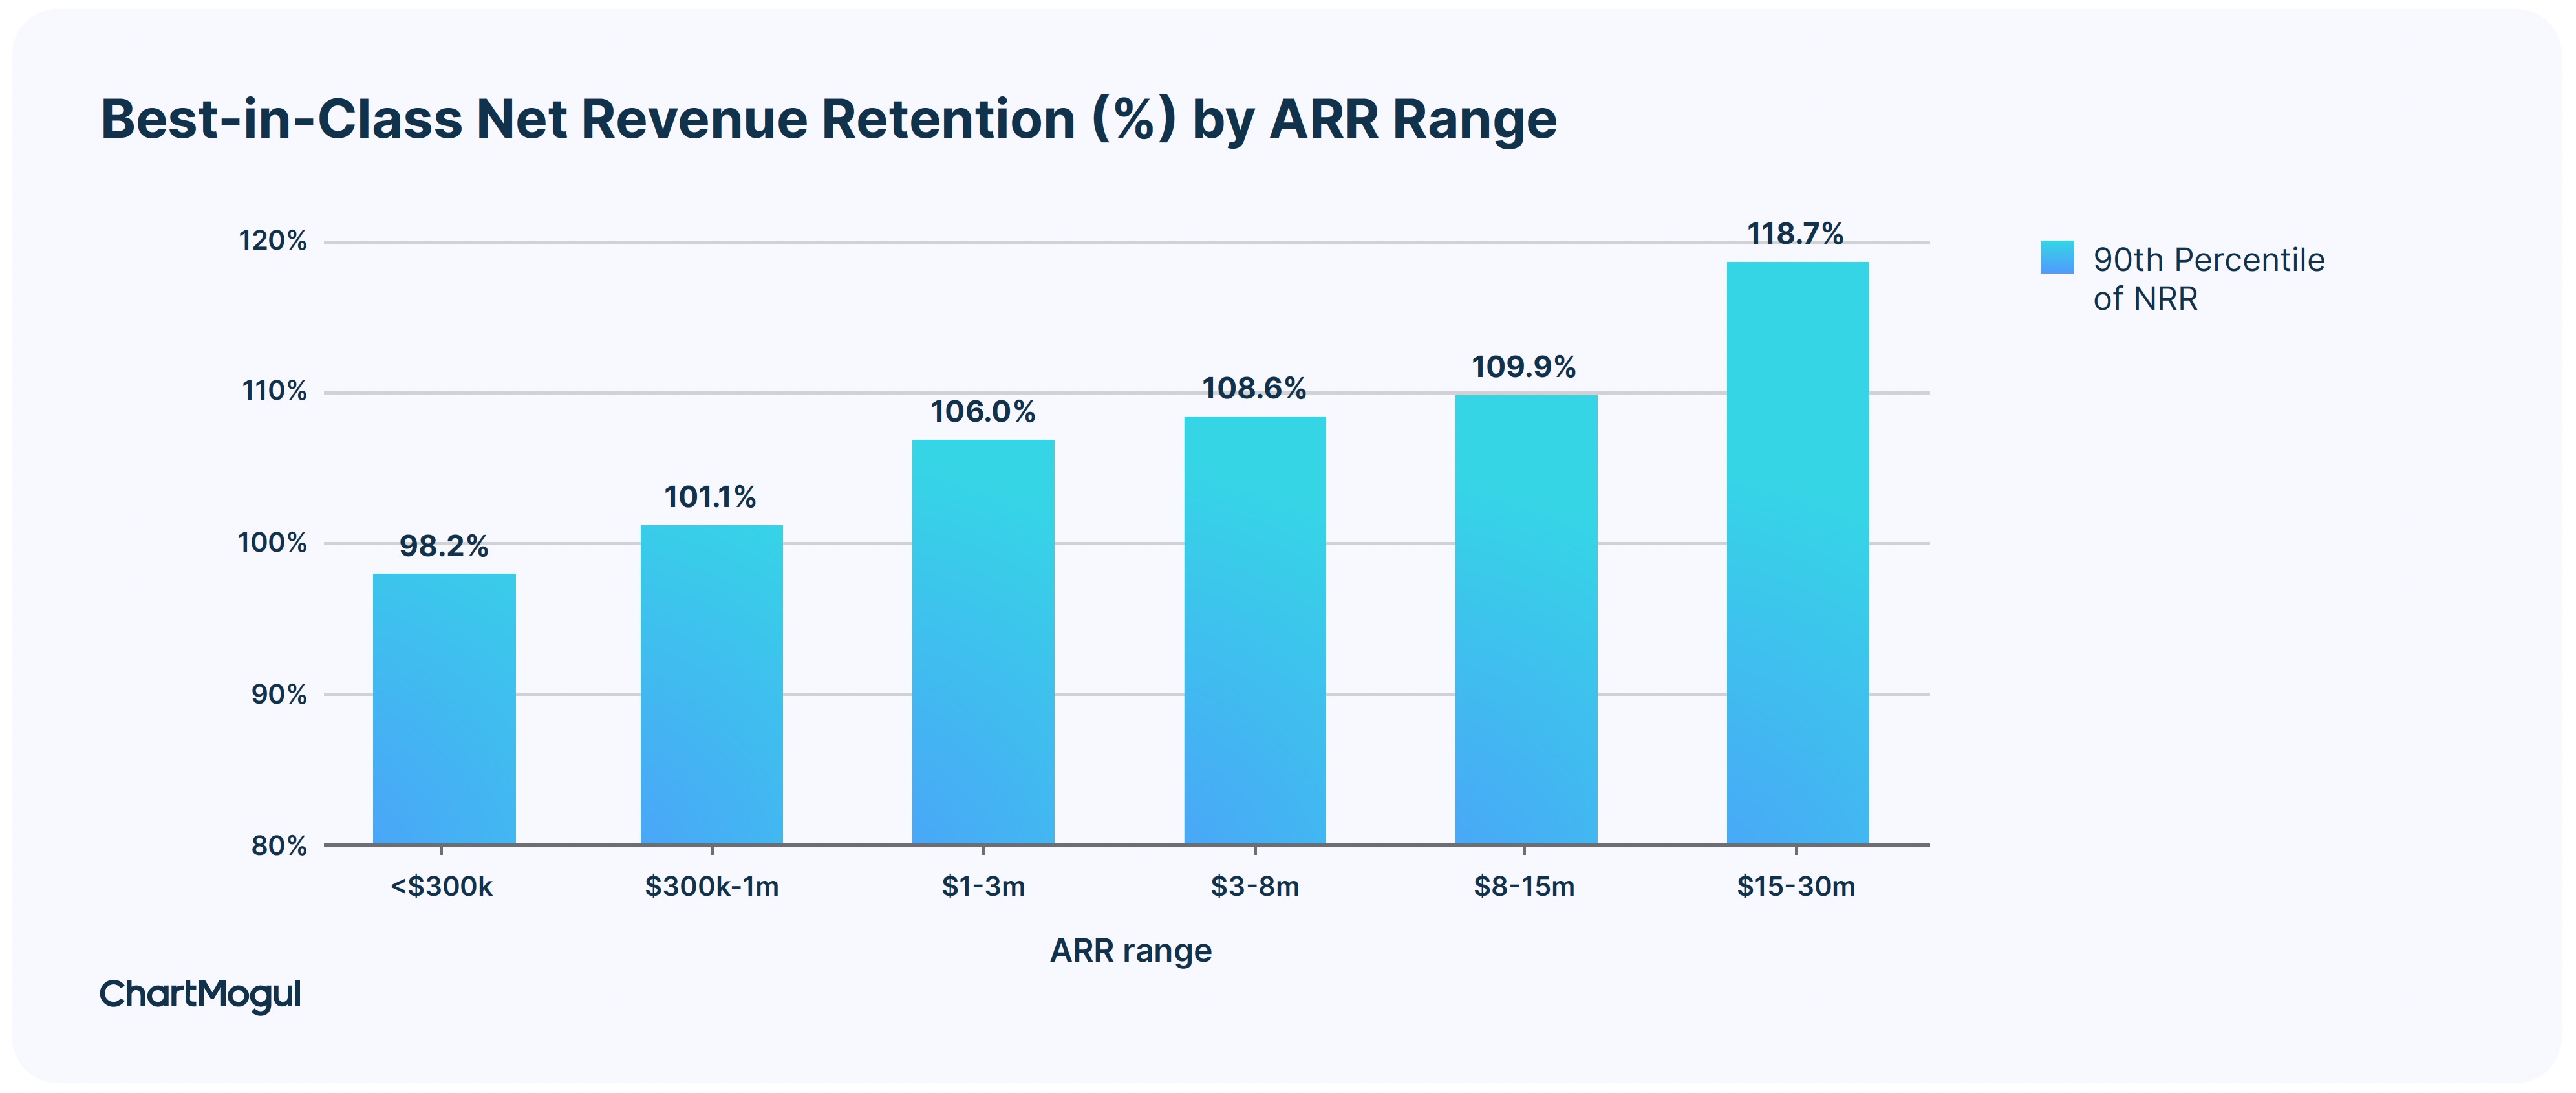
Best-in-class net revenue retention rate (%) by ARR range. Image Credits: ChartMogul
A low net retention rate might be acceptable if:
- You are an early-stage SaaS startup in the pre-product-market fit phase. You are just getting started and trying to find customers for your product. In this phase, it is expected that you will not have a strong retention rate across all customer segments.
- You have low or near zero customer acquisition costs. If you have a viral product and benefit from network effects, you might want to cast as wide a net as possible. In this case, it’s acceptable to have low retention temporarily.
- You operate in the B2C space. Retention rates are generally lower in B2C. It’s unlikely that your B2C startup will have as high a retention rate as those that operate in the B2B market.
B2B SaaS businesses enjoy higher net retention than B2C SaaS
How your business operates depends on who you sell to. Companies are a lot more similar at a particular average revenue per month (ARPA) band than you’d expect, especially in terms of retention. The length of the sales cycle, the tenure of your contract, discounting, onboarding, the type of customer support and even retention strategies all depend on your ARPA. Generally speaking, B2C companies have a lower ARPA compared to B2B companies.
The higher the ARPA, the higher the net retention rate. Companies with an ARPA of less than $10 per month have a top-quartile net retention rate of 65.1%. As you go upmarket in the B2B space, retention keeps improving. Companies with an ARPA greater than $500/month or with an ACV (annual contract value) of more than $6,000 have a top-quartile retention rate of 109.3%.
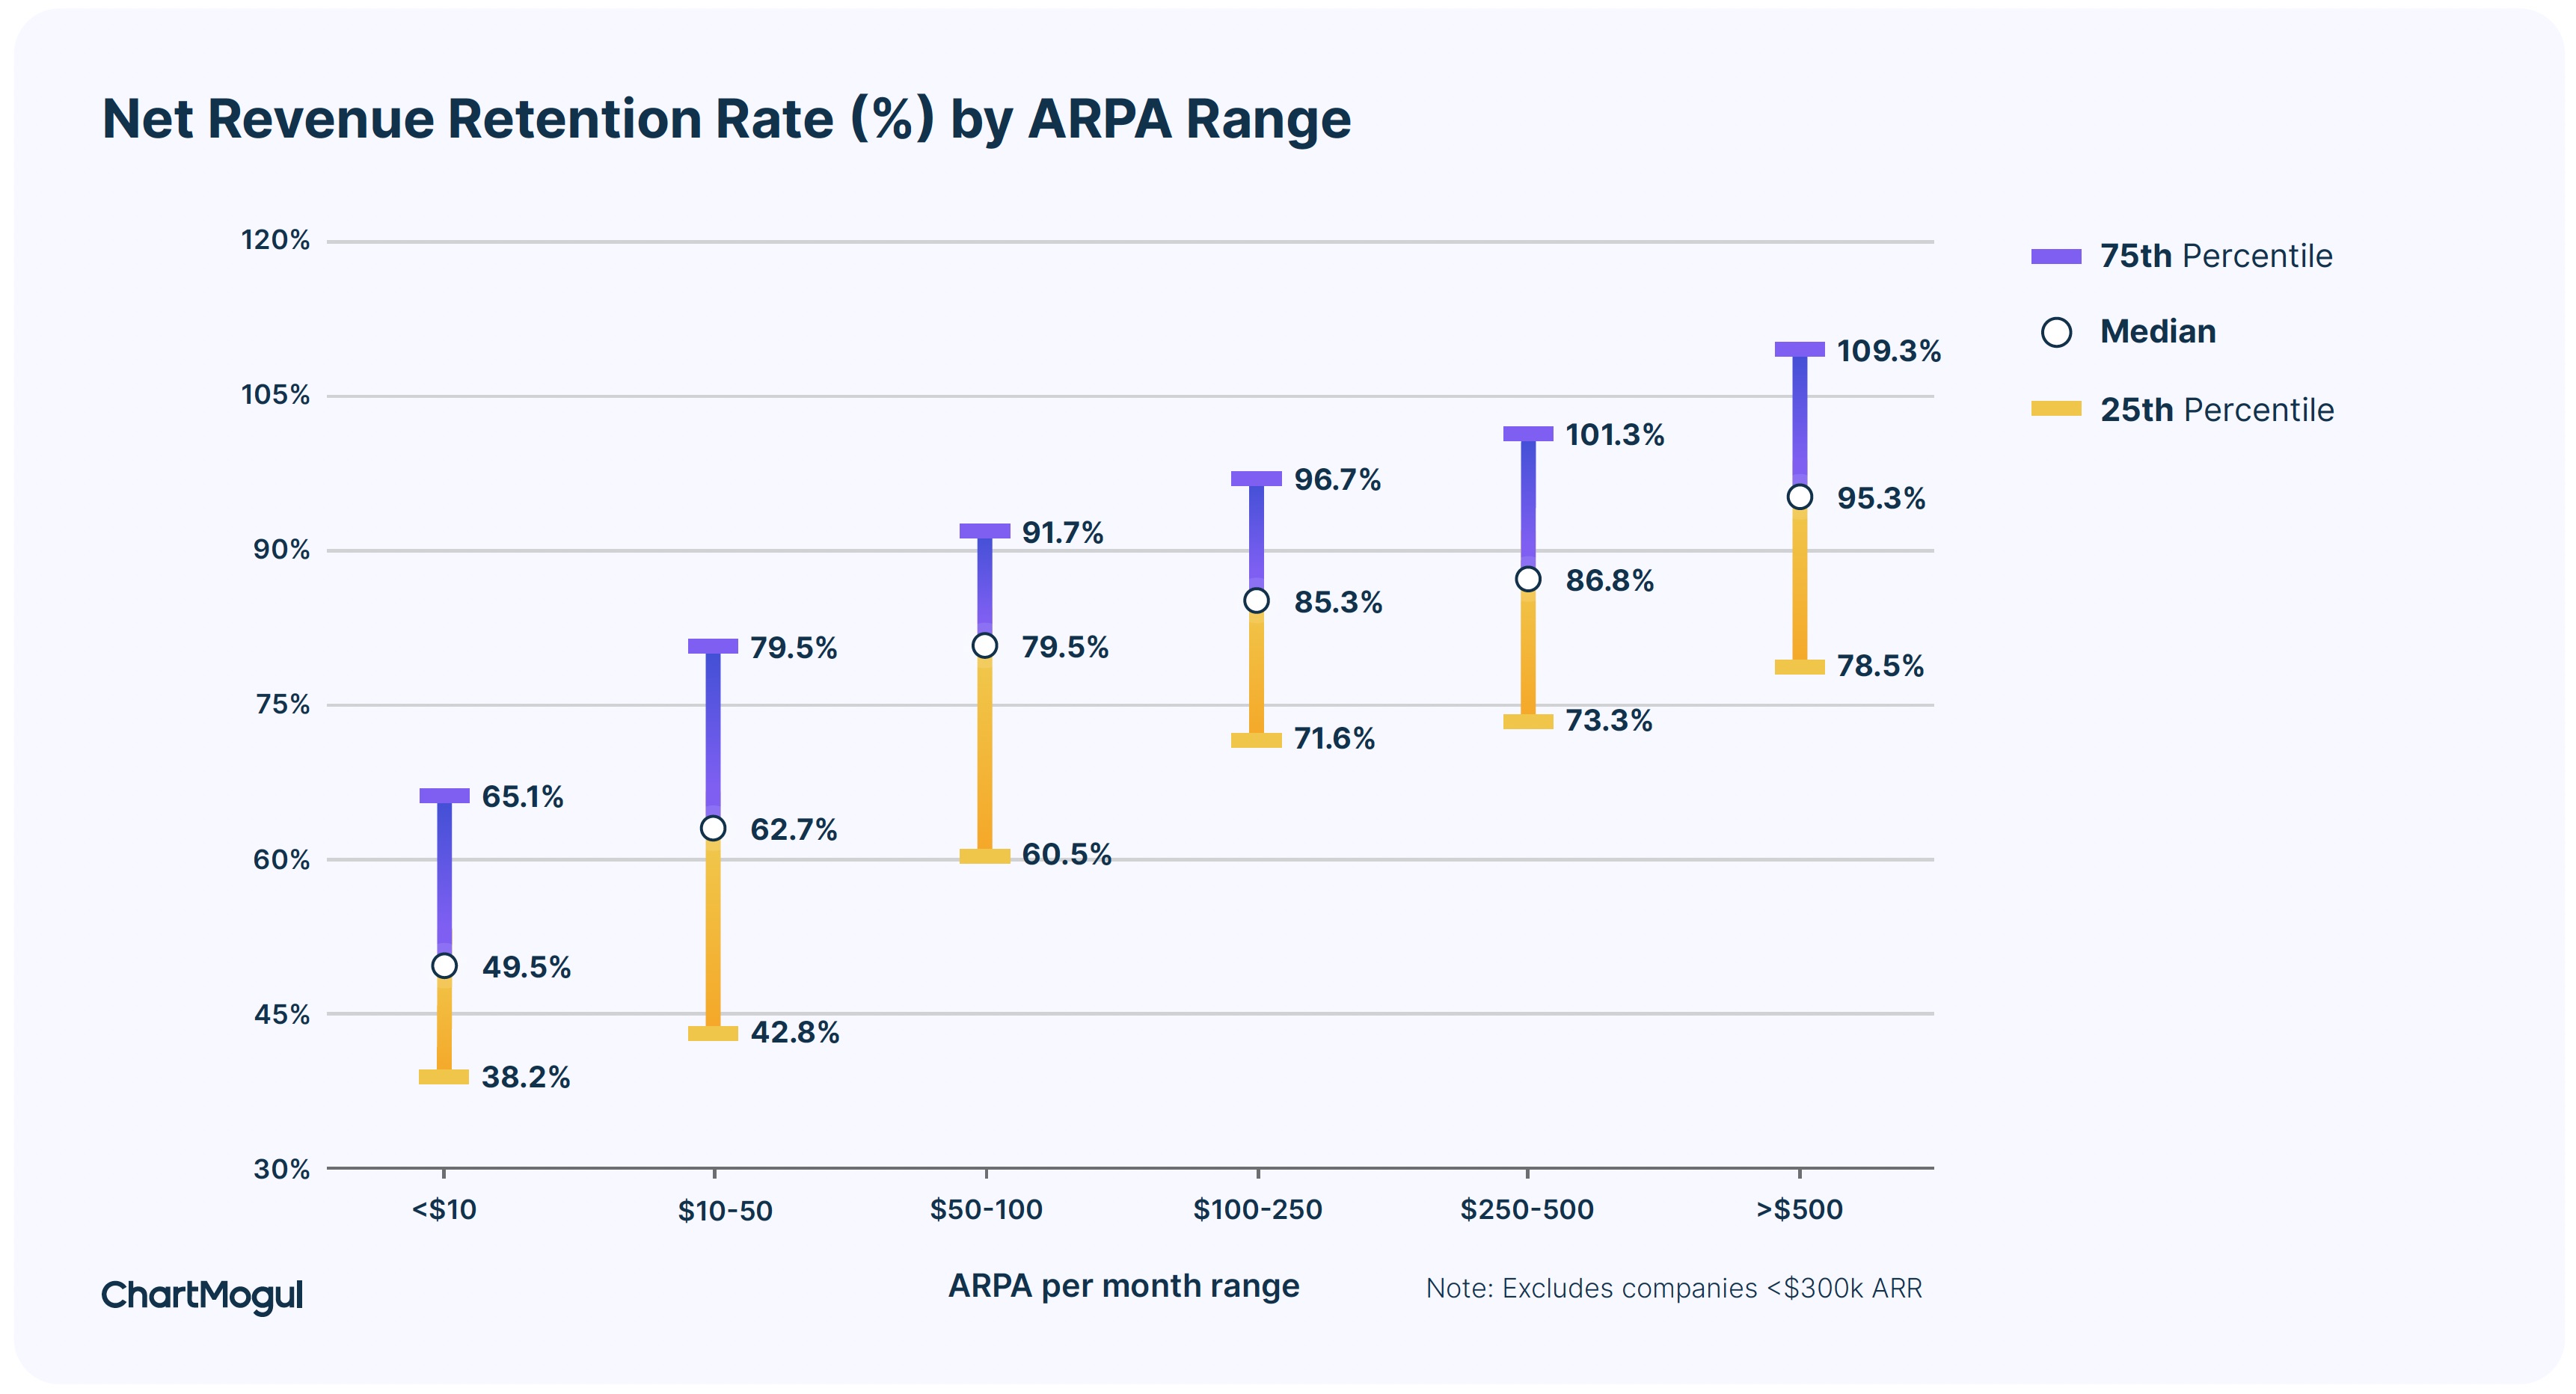
Net revenue retention rate (%) by ARPA range. Image Credits: ChartMogul
It’s hard for B2C businesses to have high net retention rates. That’s because, in B2C, churn is higher and expansion is lower. Churn is higher because of a lot of knee-jerk buying by the individual customers and expansion is lower because there are fewer upselling and cross-selling opportunities.
Only 2.7% of SaaS businesses with an ARPA less than $10/month have net retention rates over 100%. In contrast, in B2B SaaS, it’s table stakes for you to have net retention near or over 100%. Over 41% of SaaS businesses with an ARPA over $500/month have net retention over 100%.
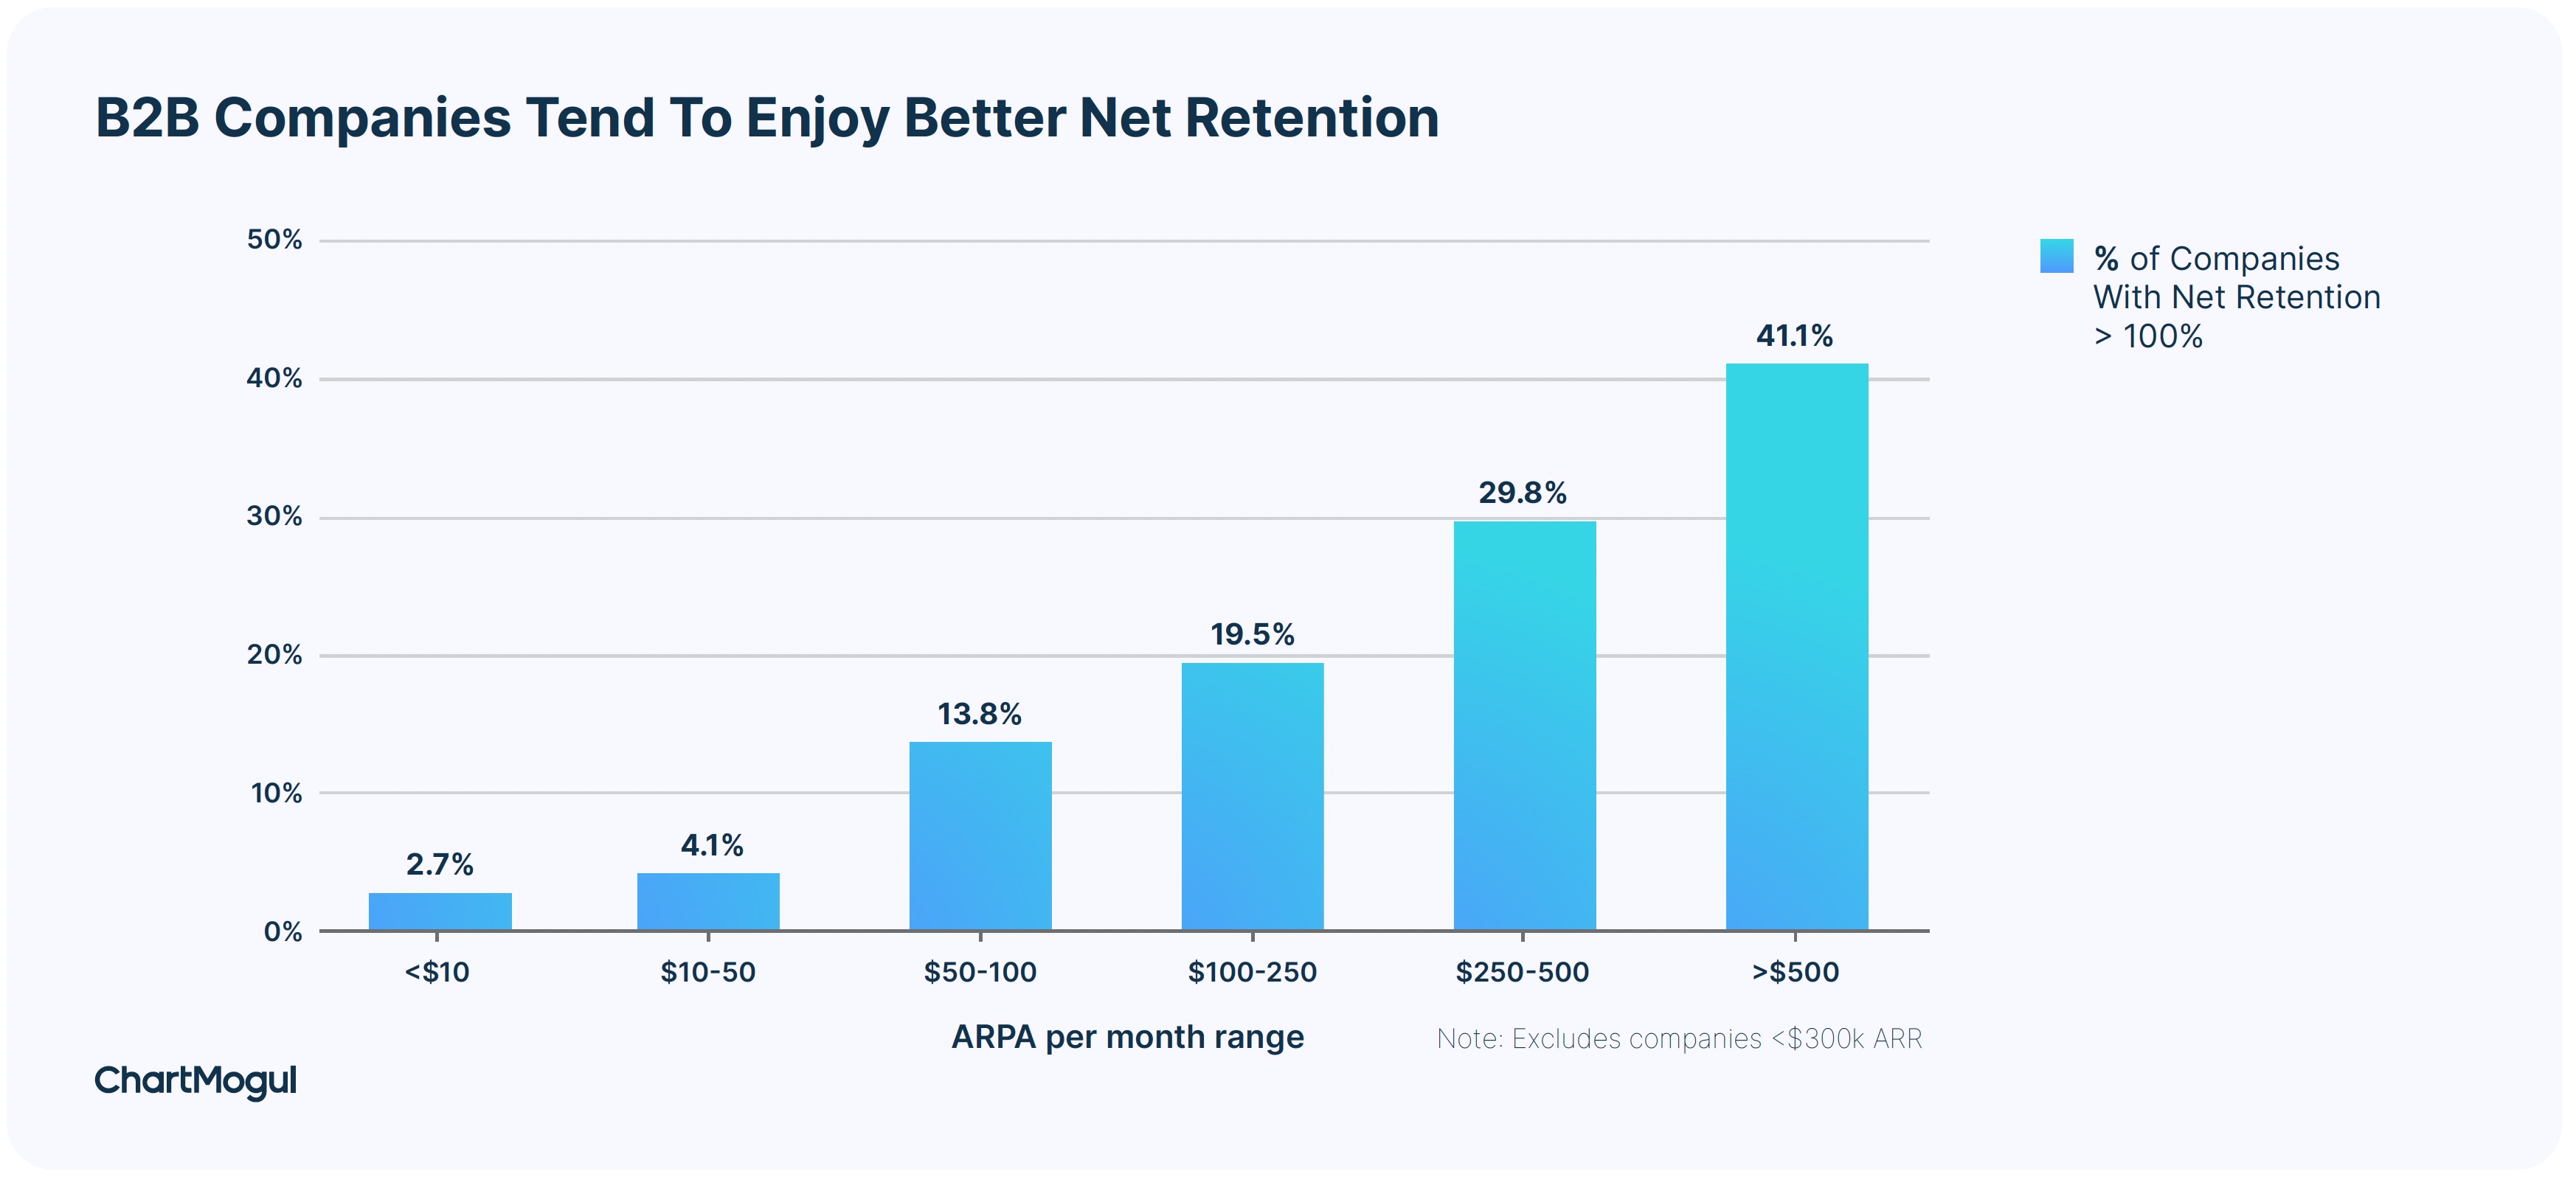
B2B companies tend to enjoy better net retention. Image Credits: ChartMogul
Best-in-class net revenue retention varies by the ARPA band you are in. For B2B SaaS selling to midmarket and enterprise, it should be in the range of 115%-125%.
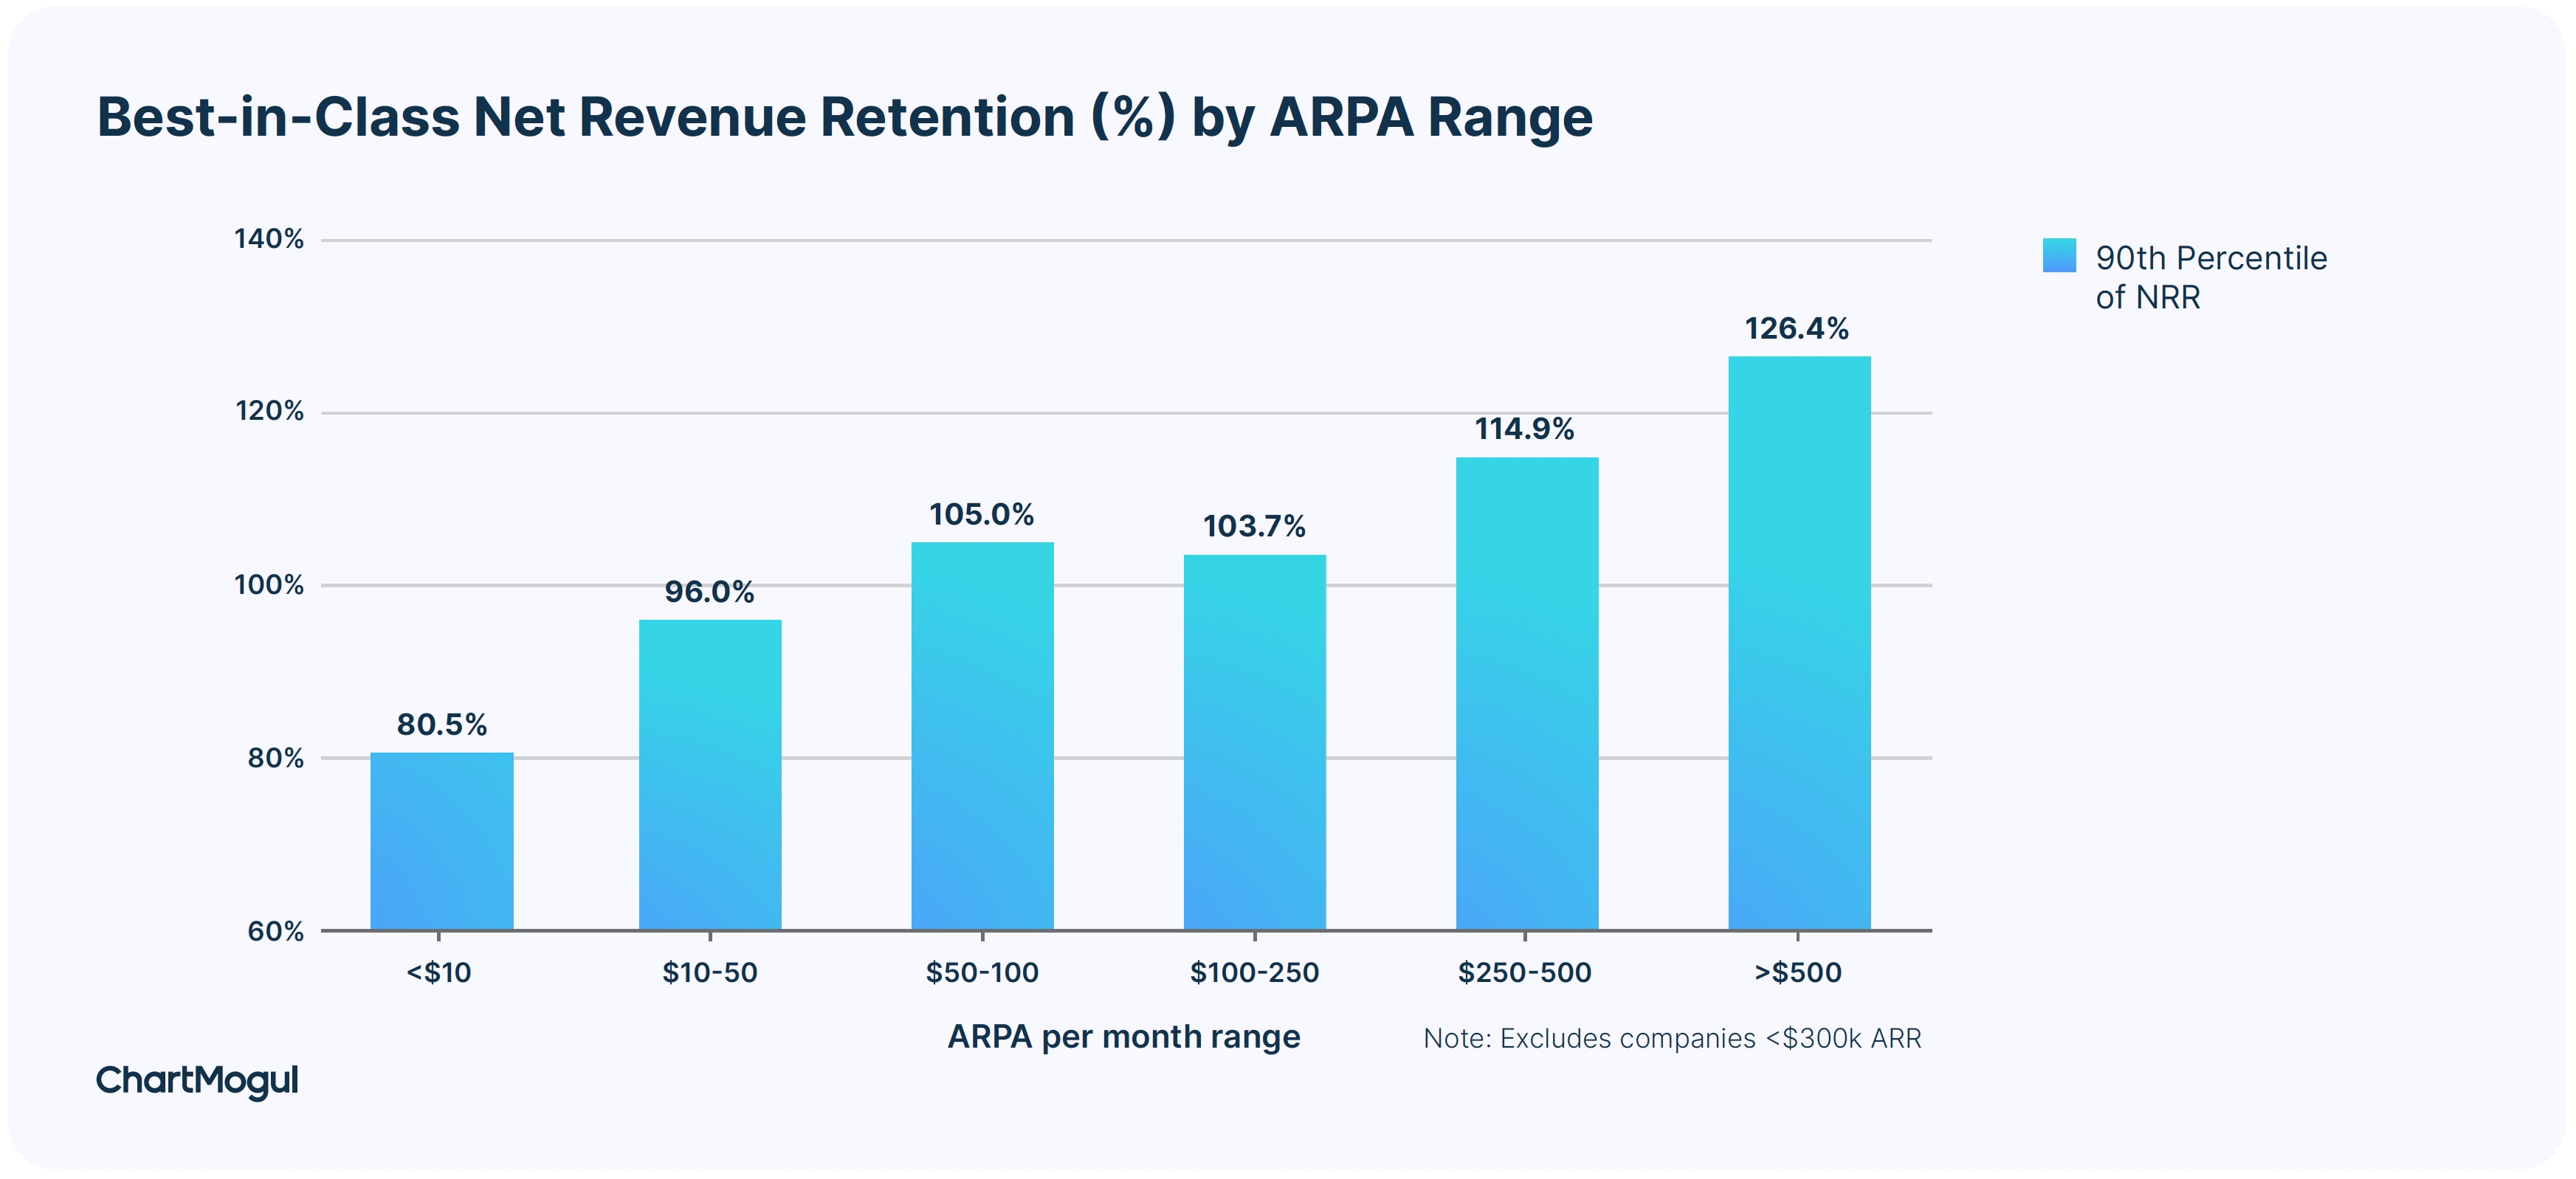
Best-in-class net revenue retention (%) by ARPA range. Image Credits: ChartMogul
Expansion is the key driver of higher net retention at higher ARRs and ARPAs
A tick over 37% of revenue added for SaaS businesses with ARR in the range of $15 million-$30 million comes from expansion. At scale, if you are not upselling or cross-selling to your existing customers, you are missing out on key growth opportunities.
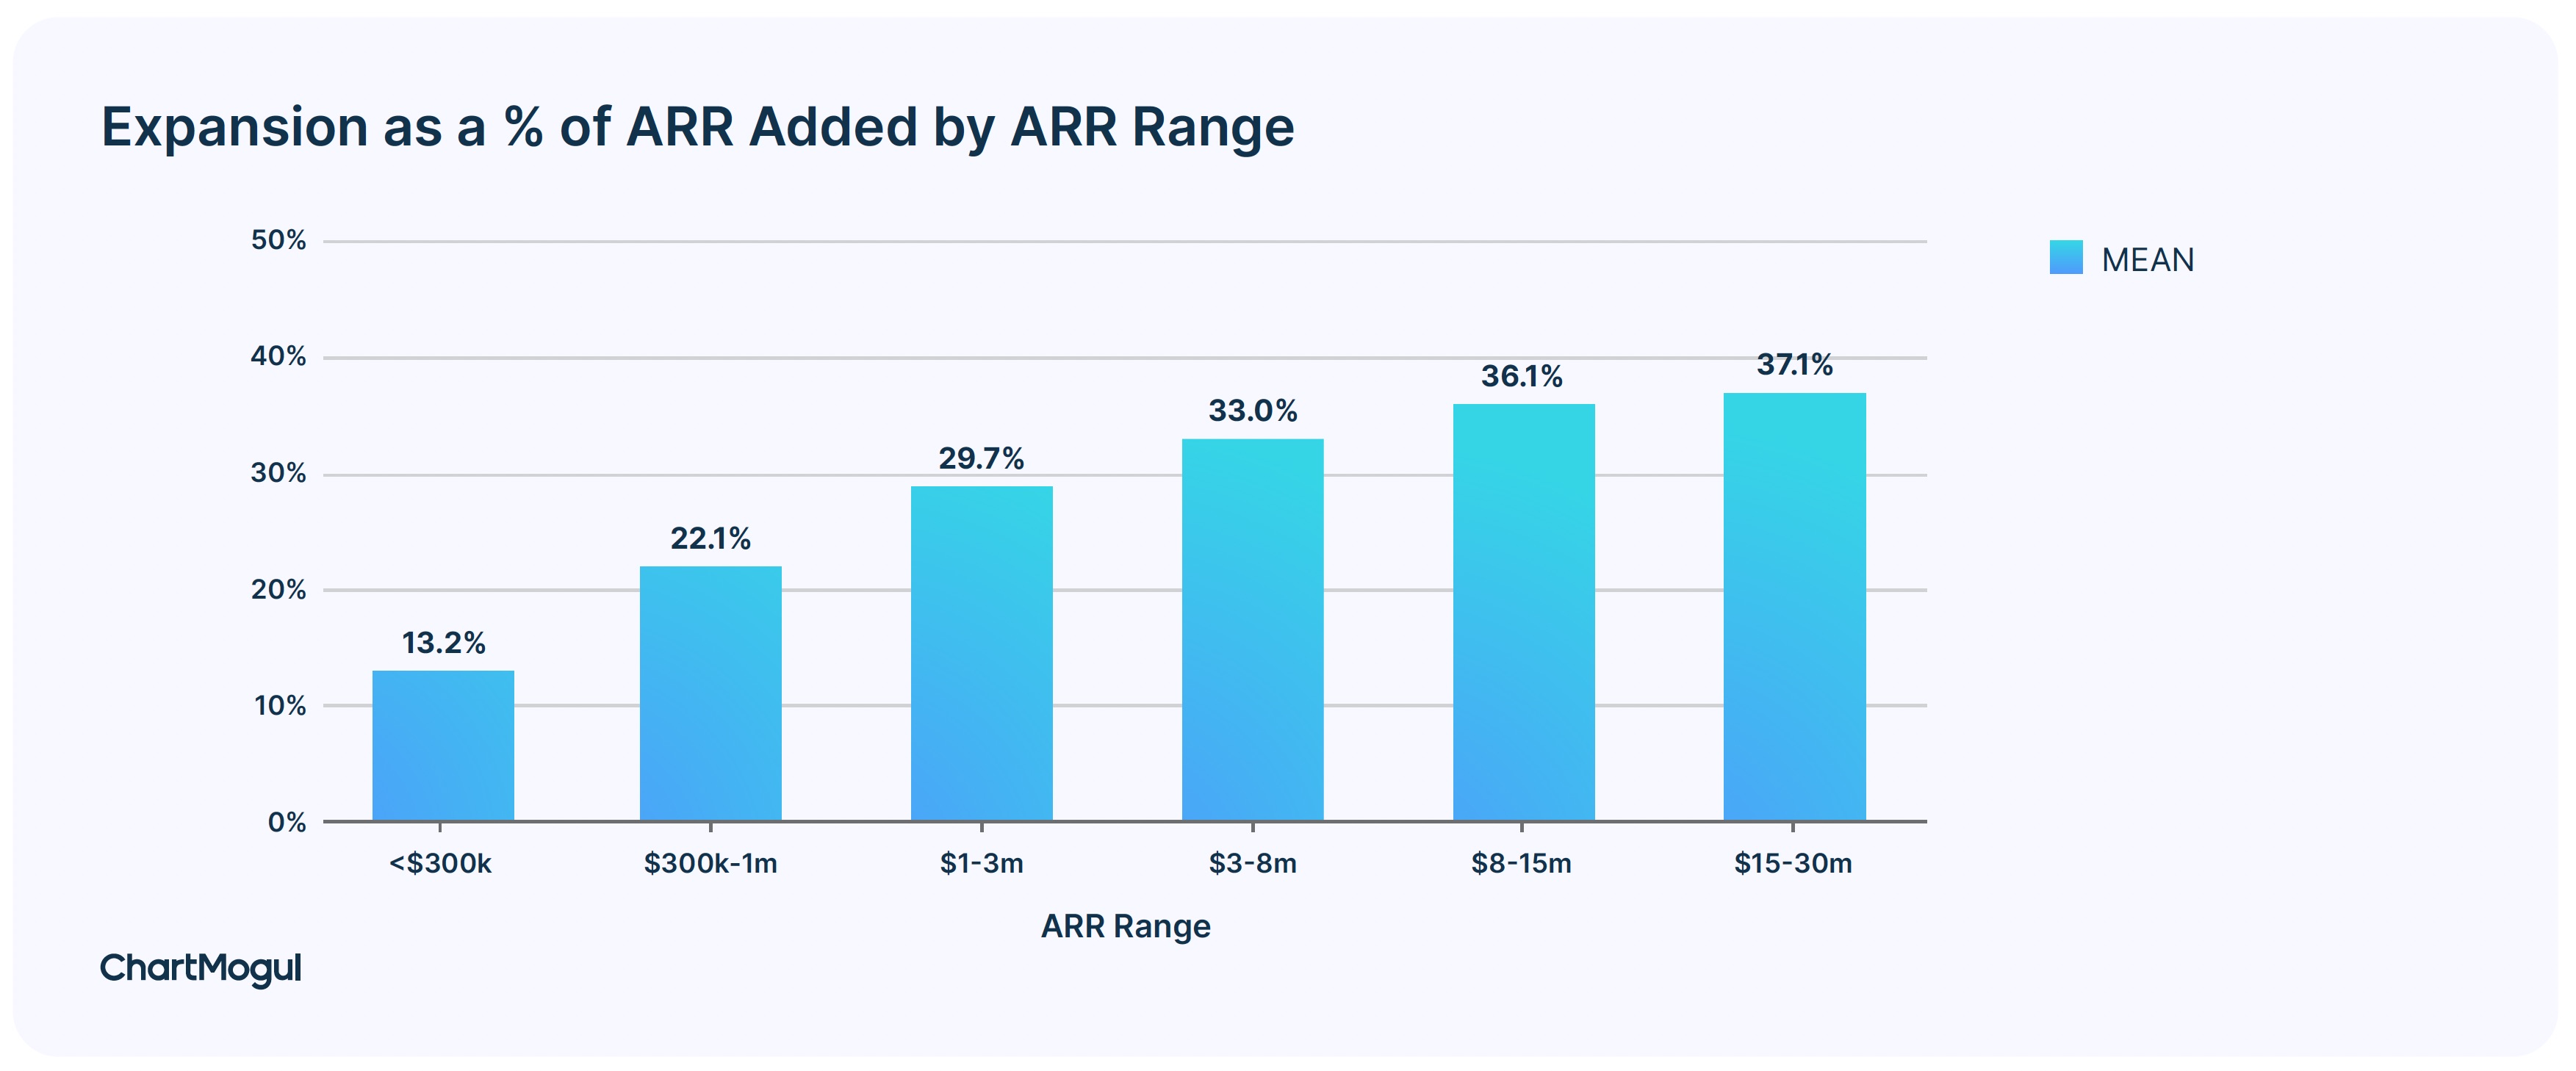
Expansion as a percentage of ARR added by ARR range. Image Credits: ChartMogul
For businesses with ARPA over $500/month, 39.2% of revenue added comes from expansion. At higher ARPAs, companies are able to upsell and cross-sell much more. This means higher expansion revenue. As you’d expect, this drives up the net retention rates at higher ARPAs.
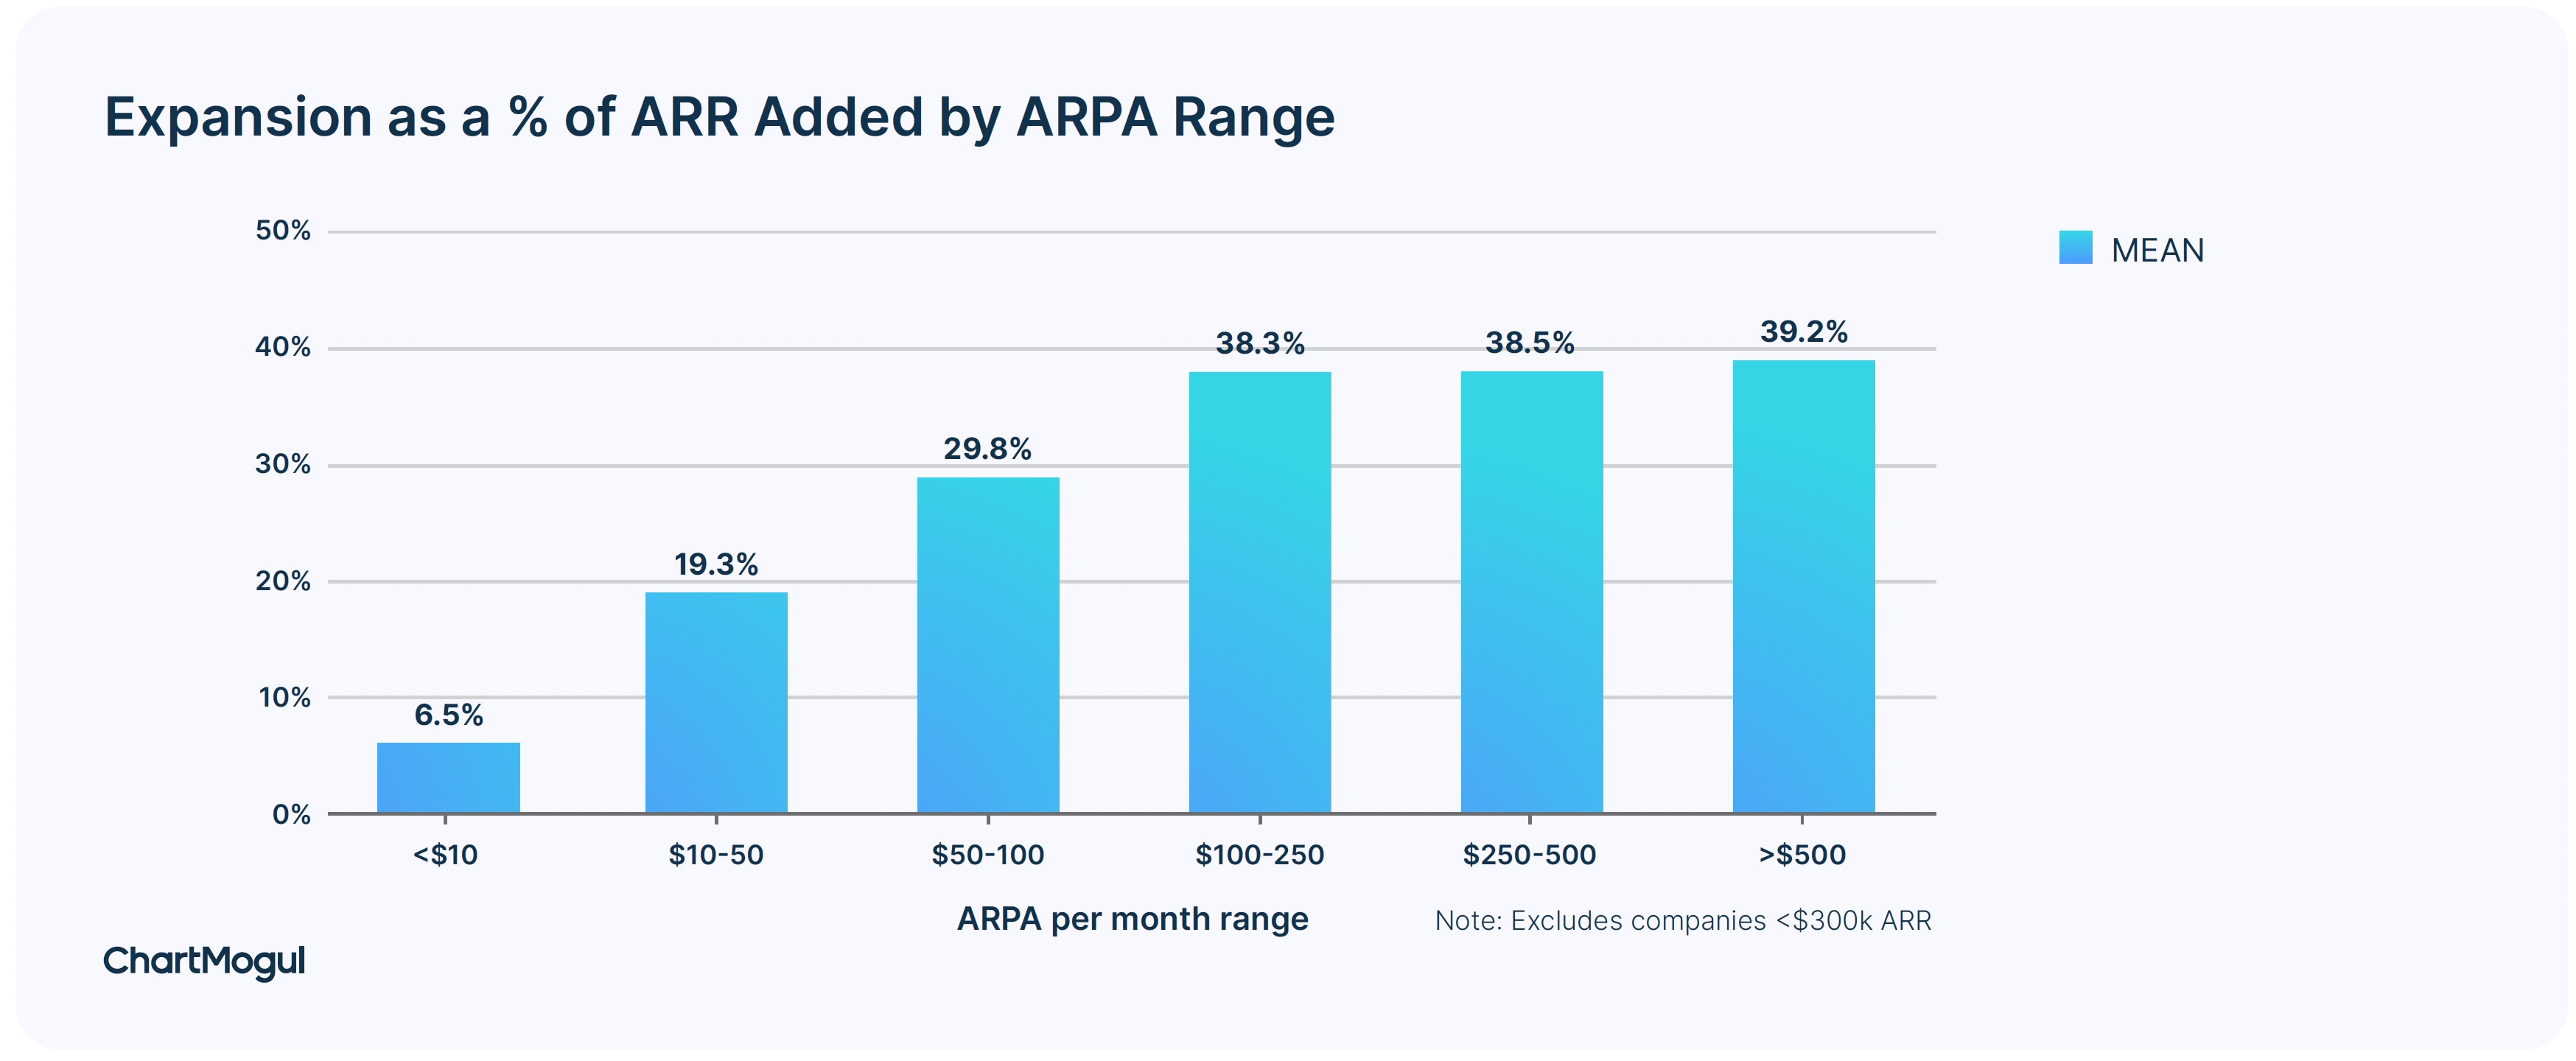
Expansion as a % of ARR added by ARPA range. ARR Added = Sum of New Business, Expansion and Reactivation ARR. Image Credits: ChartMogul
Retention should be a top companywide priority
Traditionally, the customer success leader is the one who owns the retention metric. They are responsible for activities that increase retention such as onboarding, education, account management, upselling, expansions and renewals.
However, like revenue growth, retention is touched by every part of the business. Product and engineering drive product adoption, user satisfaction and customer value creation. Finance teams drive payment terms and timely invoicing. And the entire back office supports customer success across the company. While one department may own goals around retention metrics, a high retention rate should be a top priority for the business.
Methodology
We analyzed anonymized and aggregated data from ChartMogul to calculate all aggregates. We only considered companies active for the full 12 months when calculating the aggregates.
Unless stated otherwise, we calculated aggregates over the year 2022. Where we needed a 2-year history, we also took the year 2021 into account.