
For the tech community, the rallying cry in 2022 was about moving from the growth-at-all-costs mindset toward emphasizing profitability.
We believe that in turbulent times, startups and scaleups alike need to ensure:
- They have sufficient runway to ride out a downturn without relying on large amounts of external funding.
- They are developing fundamentally healthy businesses with attractive economics and a cost structure built for efficient growth.
While every company is unique and it’s difficult to create a blueprint for must-track metrics across stages and business models, we’ve found three metrics that provide helpful green, yellow and red diagnostics amidst the deluge of metrics you can track:
Cash burn efficiency
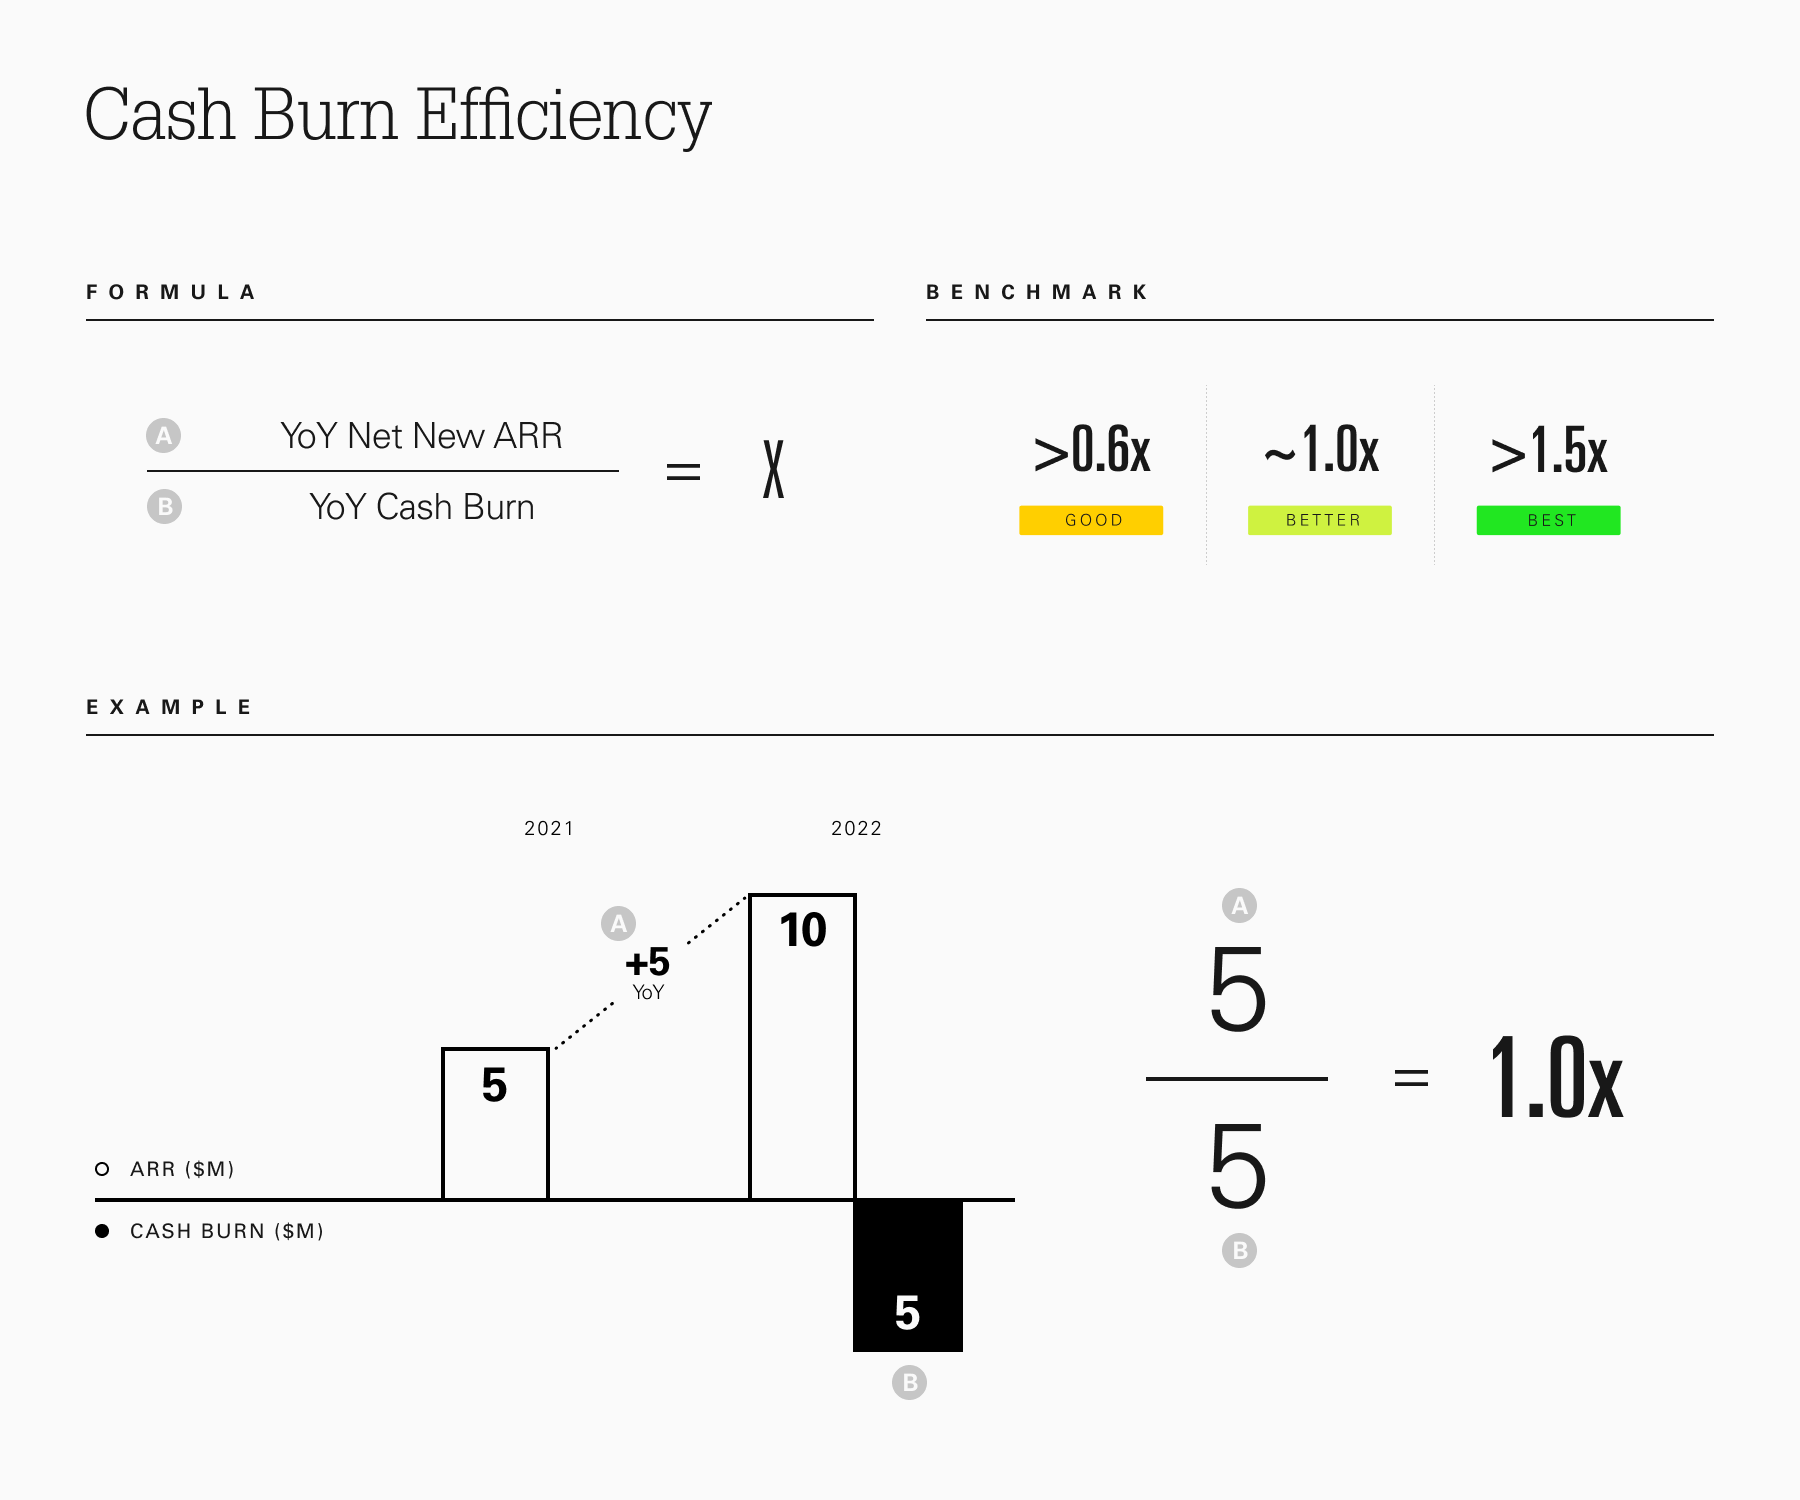
Image Credits: Paris Heymann
The majority of startups and scaleups are focused on burning cash. It makes sense to, because building and scaling an organization requires meaningful investment, often before a company can generate enough revenue to pay the bills. The key is to ensure that burn is prudent and efficient.
One way to analyze whether progress toward profitability looks healthy is to analyze incremental profit margin from one period to the next.
In general, if you are earning net new ARR of $1 for each dollar spent, you are in a strong position — your net new ARR to burn ratio is 1, which is healthy relative to benchmarks. A ratio greater than 1.5x is best-in-class, and if it’s below 0.6x, a closer look may be warranted.
We view cash burn efficiency as an effective shorthand metric to keep an eye on. If you need to spend more than $2 to generate revenue of $1, it may be a signal that growth is being “forced” and is therefore unsustainable.
Incremental profit margin
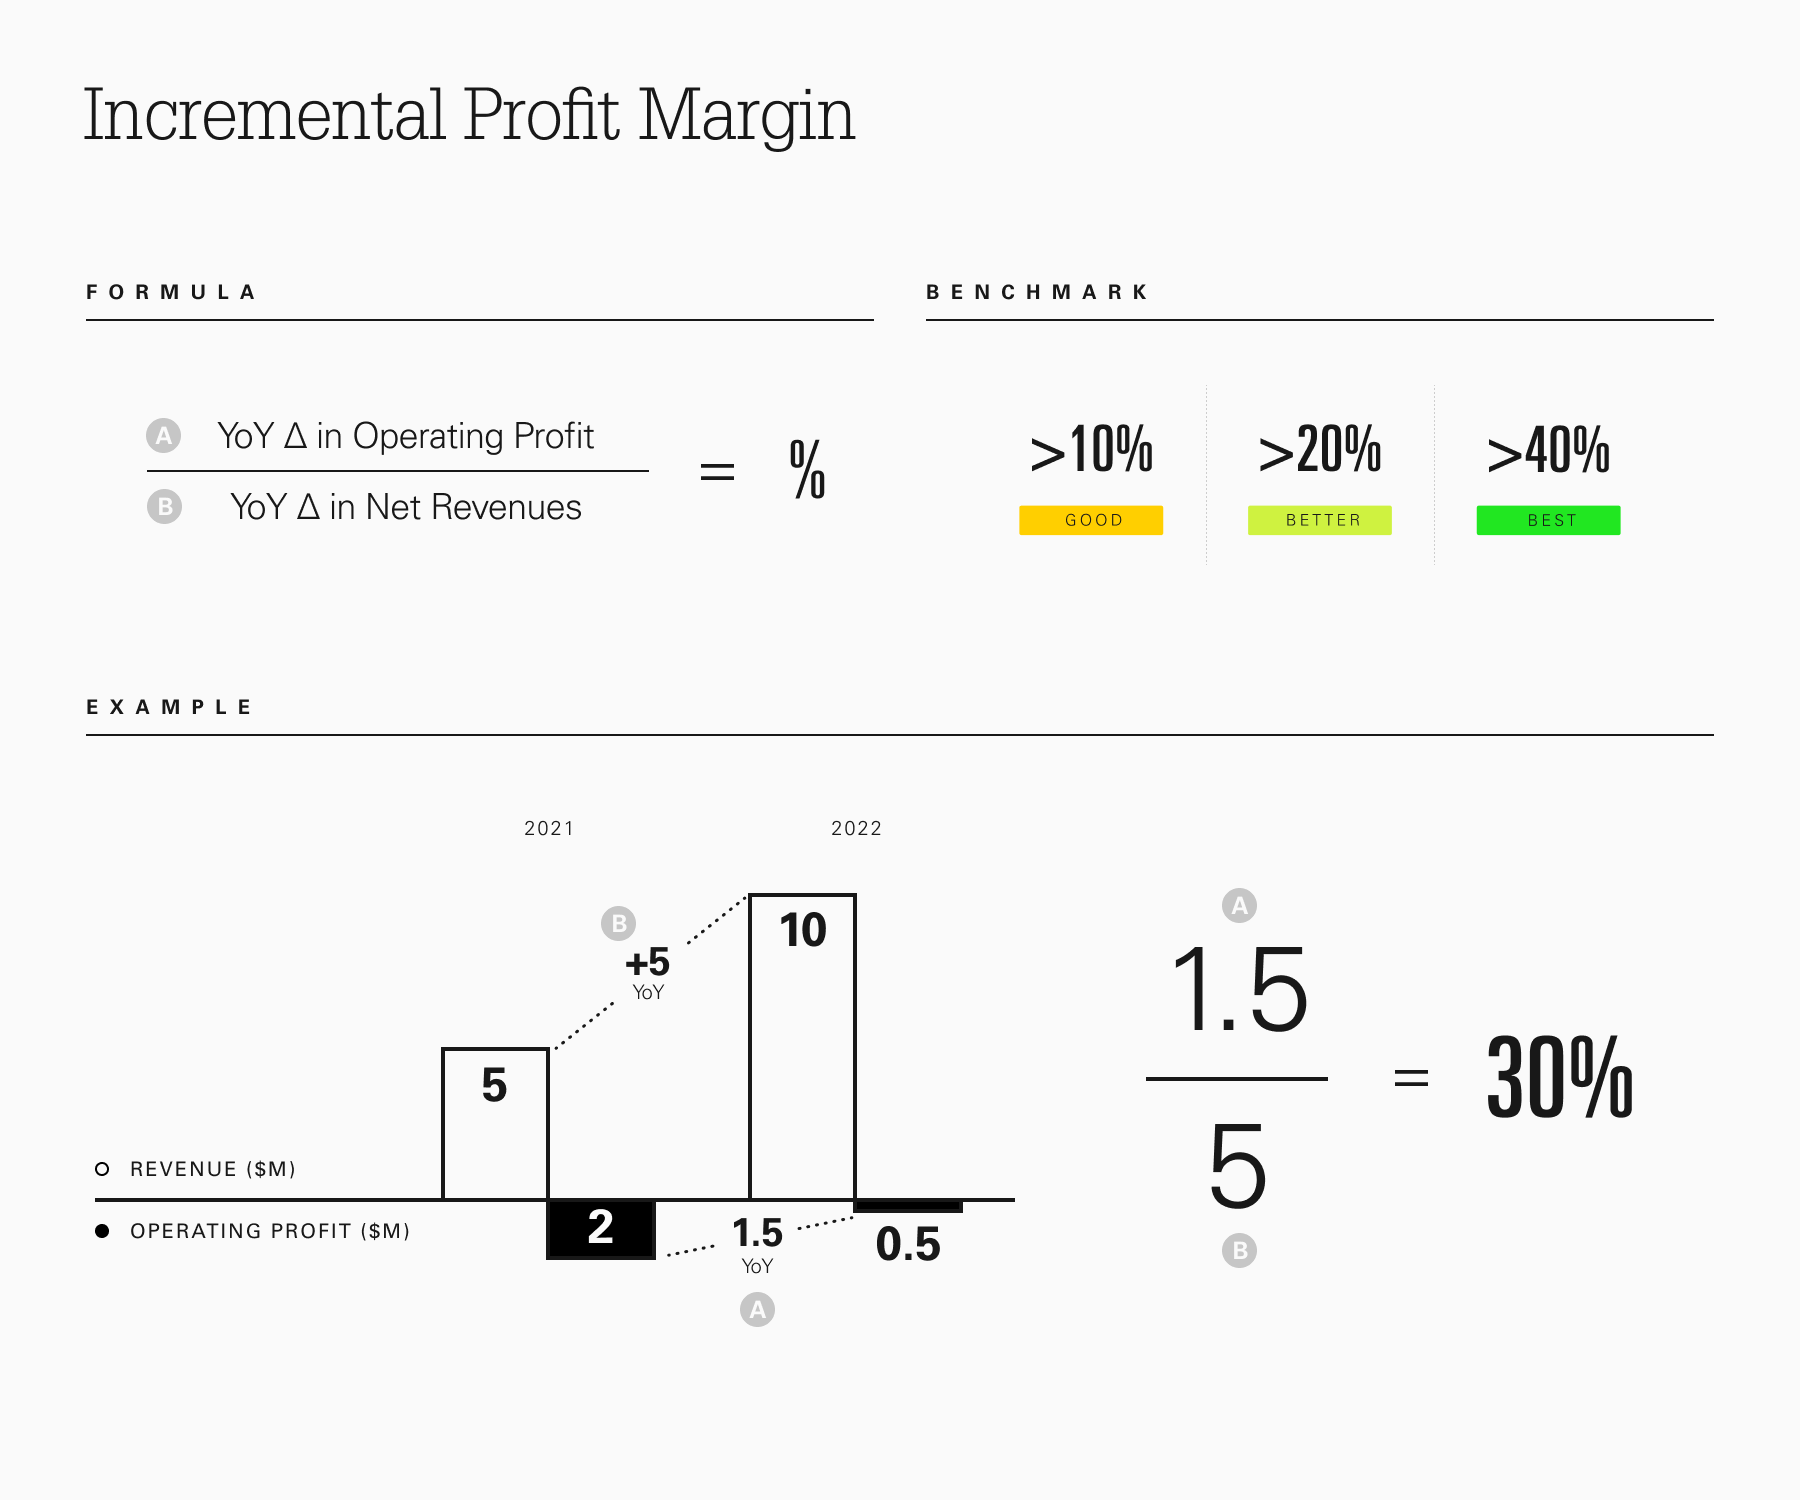
Image Credits: Paris Heymann
Profitability is often discussed in absolute terms, but it’s important to remember that companies typically progress toward profitability over time. That progression can either be smooth, pointing to a strong economic core, or it can be more erratic, indicating that closer attention could be warranted.
One way to analyze whether progress toward profitability looks healthy is to analyze incremental profit margin from one period to the next. This metric is great for understanding how much of revenue is converting to operating profit.
Anything at or above 40% is best-in-class, and if it’s above 20%, you’re beginning to look healthy. It’s worth taking a very close look at your cost structure if your incremental profit margin is trending at 10% or lower. Over time, incremental profit margin should theoretically converge with gross margin less any other variable costs (e.g., customer acquisition).
Pre-S&M profit margin
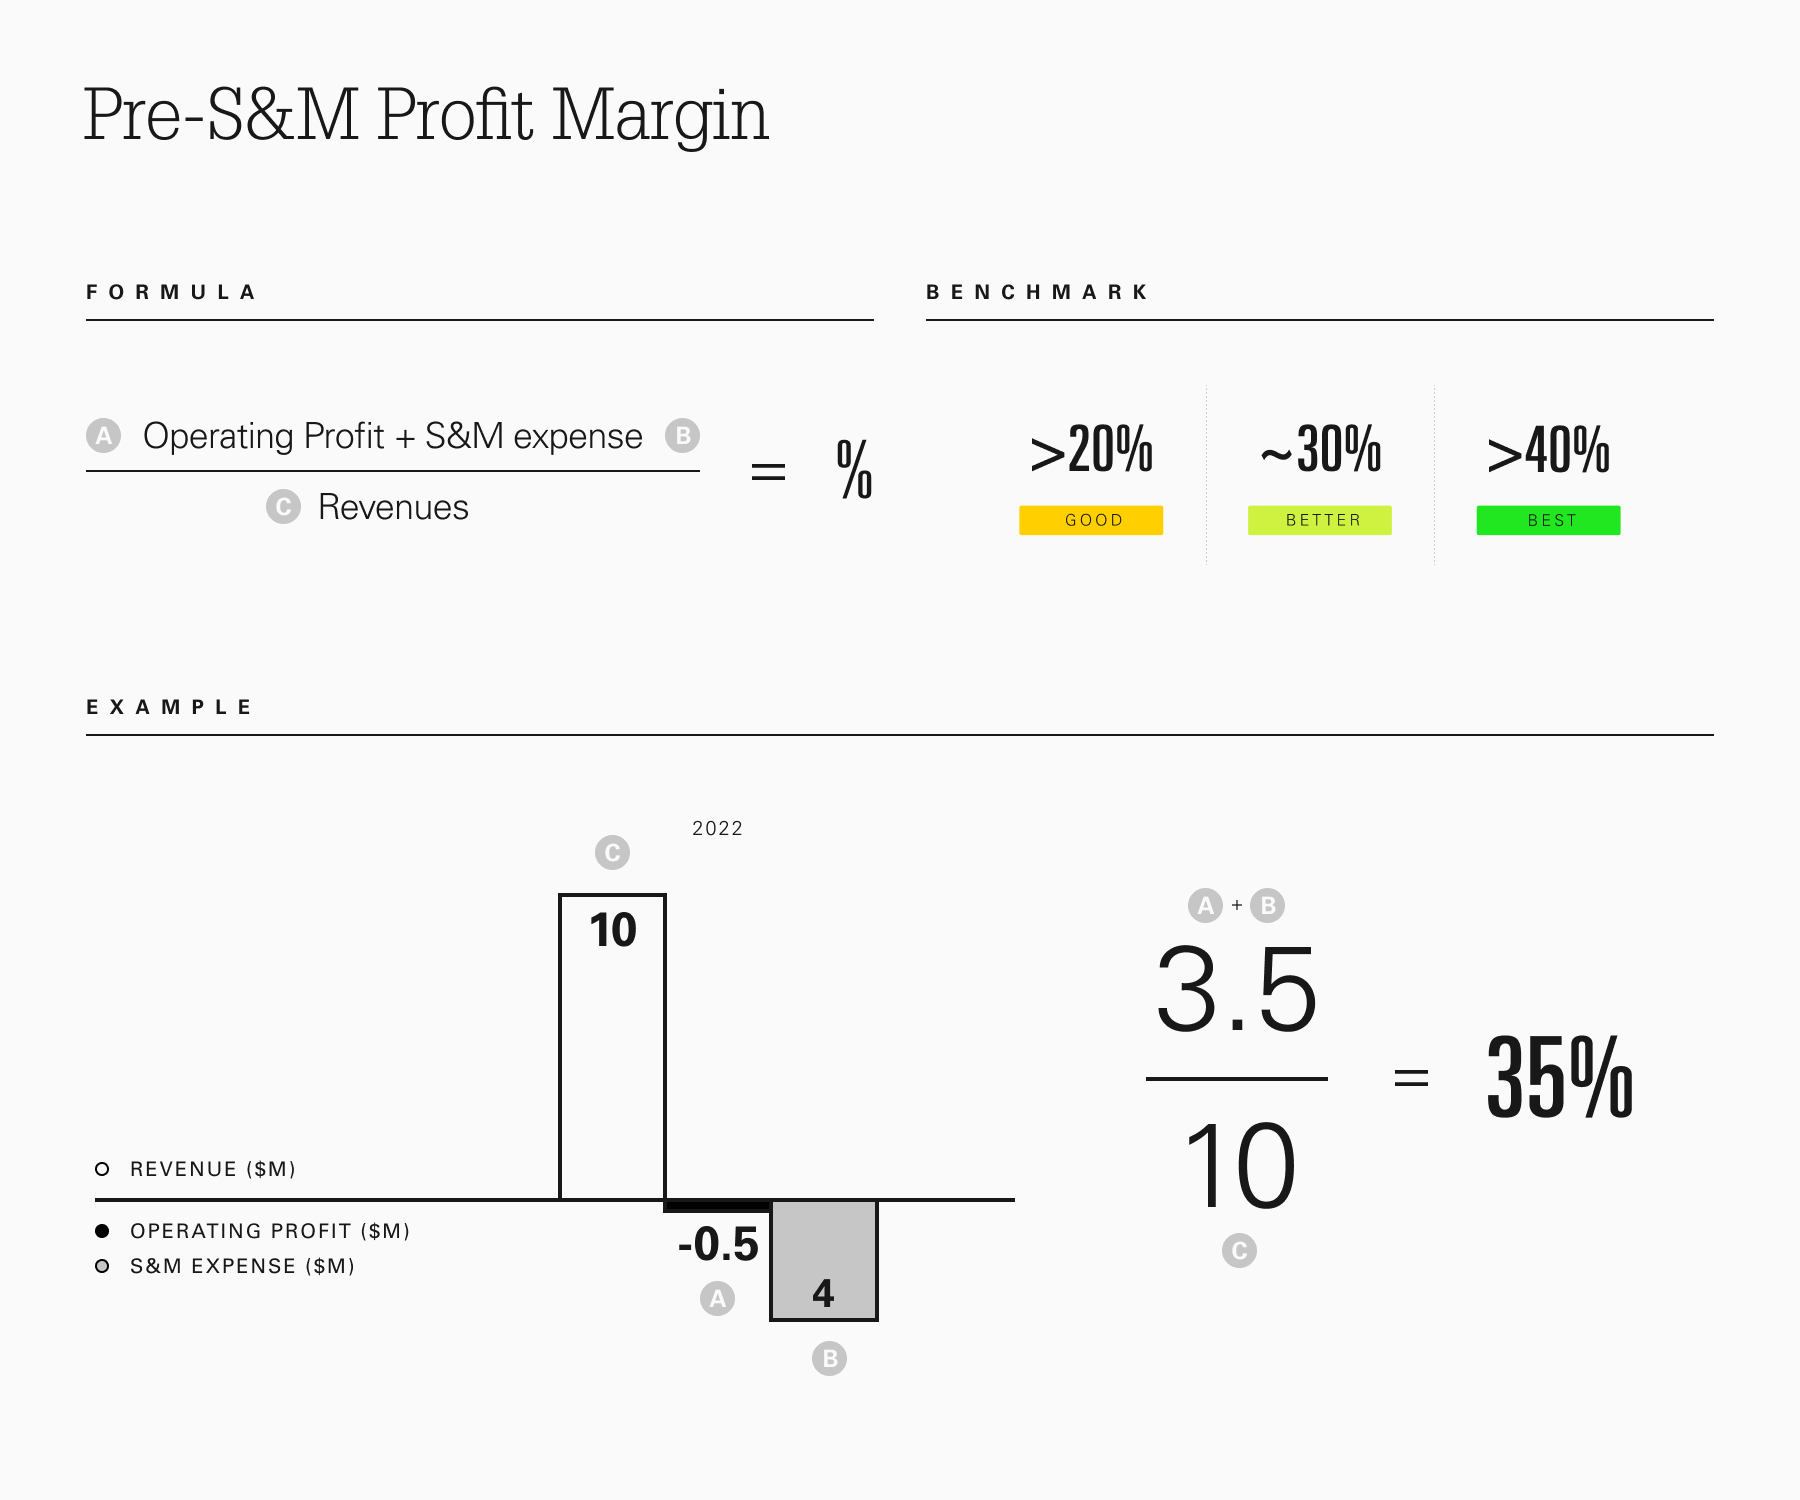
Image Credits: Paris Heymann
Technology companies typically group operating expenses into three categories: Sales and marketing (S&M), research and development (R&D), and general and administrative (G&A).
If you have a highly retentive product, S&M could be considered an investment in future growth and a variable expense instead of a fixed expense. R&D and G&A are typically considered more fixed in nature, as they’re related to maintaining your current revenue base and customer relationships.
Given that S&M is considered an investment, one helpful metric to analyze cost structure is pre-S&M profit, which takes operating profit margin and adds back sales and marketing expenses. This tells you how much margin you have before investing in S&M. A pre-S&M profit margin of approximately 20% or more can be considered quite healthy because it means your company has enough of a budget to invest in S&M. Anything above 40% would be considered best-in-class.
Similar to the incremental profit margin, it’s more important to look at the trajectory over time rather than the absolute number to ensure healthy progression.
Remember that there’s oodles of nuance involved in evaluating cost structures, and there are always exceptions that break benchmarks. Additionally, these are not the only profitability-focused metrics that warrant tracking. We’ve also found metrics like the Magic Number, LTV to CAC and the Rule of 40 to be helpful financial indicators.
In strong macroeconomic times, these metrics can go overlooked and underappreciated, but they are now important as capital efficiency has returned as a critical strategic priority for nearly all companies.