
Of every 100 deals a VC firm considers, about a quarter get a meeting, and only one ends up securing investment. Given the downturn in the markets leading to a startup funding squeeze, getting through the door is a critical first step.
But then what? How do you prove you’re that one in 100? Well, you have one drastically overlooked superpower: your data.
Many early-stage startups don’t have a data team or even a data expert. They’ve been told that it looks good to have cash flowing in and user numbers ticking up. But investors are looking past superficial metrics for indicators that your product is poised to grow years into the future. There’s no one metric for that, which is why you need to know exactly which ones to focus on and what they tell others about your product’s growth prospects.
If possible, collect the most granular, user-level data you can: events and transactions. Having this data allows you to X-ray how people are interacting with your product.
Visualizing and communicating this data can definitively power up a pitch deck. If you’re a founder of a new SaaS, fintech, marketplace or consumer subscription product, here’s what you should be showing investors at the early stages of your journey.
Investors need to see that you’re not being blindsided by easy wins that can go up in smoke within weeks but are using hard data to build a sustainable company.
At all stages: Focus on active usage, not vanity metrics
If you haven’t been thinking about product-market fit, you don’t have a pitch.
Now, that doesn’t mean you have to prove you have product-market fit, but you absolutely need to show investors that you’ve been working toward it. If investors can’t tell where you are in your lifecycle, they have no way of telling how close you are to getting real traction — and getting them their returns.
Product-market fit isn’t a defined point. It’s more about reading the right signals: You have to know which metrics to look at and how to measure their strength. The stronger the signals related to user engagement and retention — all measured in different ways and all trending positively — the more evidence you have that you’ve reached, or are reaching, product-market fit. Building up all that evidence through data helps bolster a pitch and increases your odds of landing an investment.
Resist the temptation to use vanity metrics. Sometimes founders will track “feel-good” stats like the total number of people who have ever signed up to their product. After all, these charts always go up and to the right.
But that kind of metric will be met with: “Good for you, but that’s not how we look at things. How many people are still using it?” It’s easier to get people to register for or even download an app on your landing page than it is to get them to stay and use that app repeatedly.
Data-driven investors use metrics derived from active usage to measure the health of a product, and there are several ways of breaking it down depending on the stage of the company.
In the early stages, look for engagement
A startup that only has a few customers should be looking for evidence that someone is repeatedly finding value in their product. Measuring how many days an active user engages with the product helps you see those who are the most engaged.
The best visual way to demonstrate engagement is a daily active users (DAU) histogram chart. This shows the number of users according to how many days they’ve been active in the last four full weeks with a simple bar graph (see image below).
Such a view of the data helps reveal any power users — people who are using your product frequently, perhaps every day or every business day. They are attracted to something in the product that keeps them coming back.
Identify those users and what they love about your product. Since this only requires the most recent 28 days of data, the DAU histogram chart doesn’t require you to build up a lot of historical data.
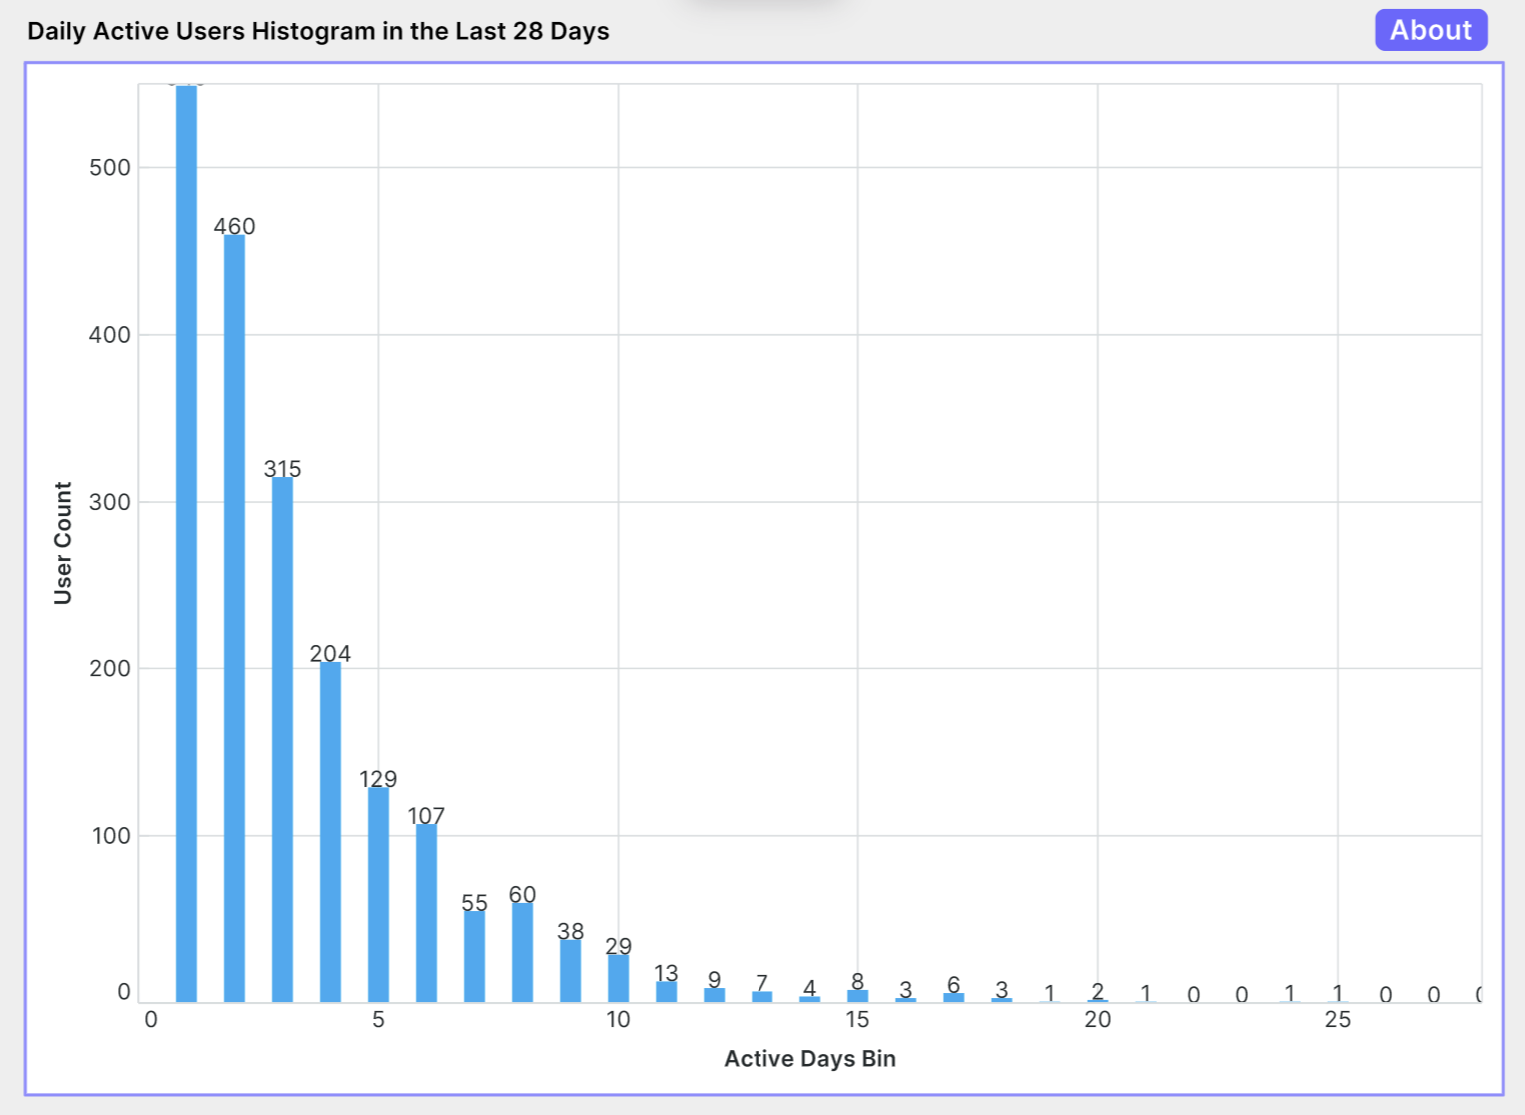
Image Credits: David K. Smith
If you have more than a few customers, look for retention
Once you have a significant number of customers, you should start adding retention to your mix of pitch data.
If engagement is the ground level, after a few months, you need to find out how many people are sticking around after days 1, 7 and 30.
If you can prove that of everyone who started using your app, about 30% continued to use it at day 30, you’re showing that some people find usefulness and usability in your product after making it through the onboarding process.
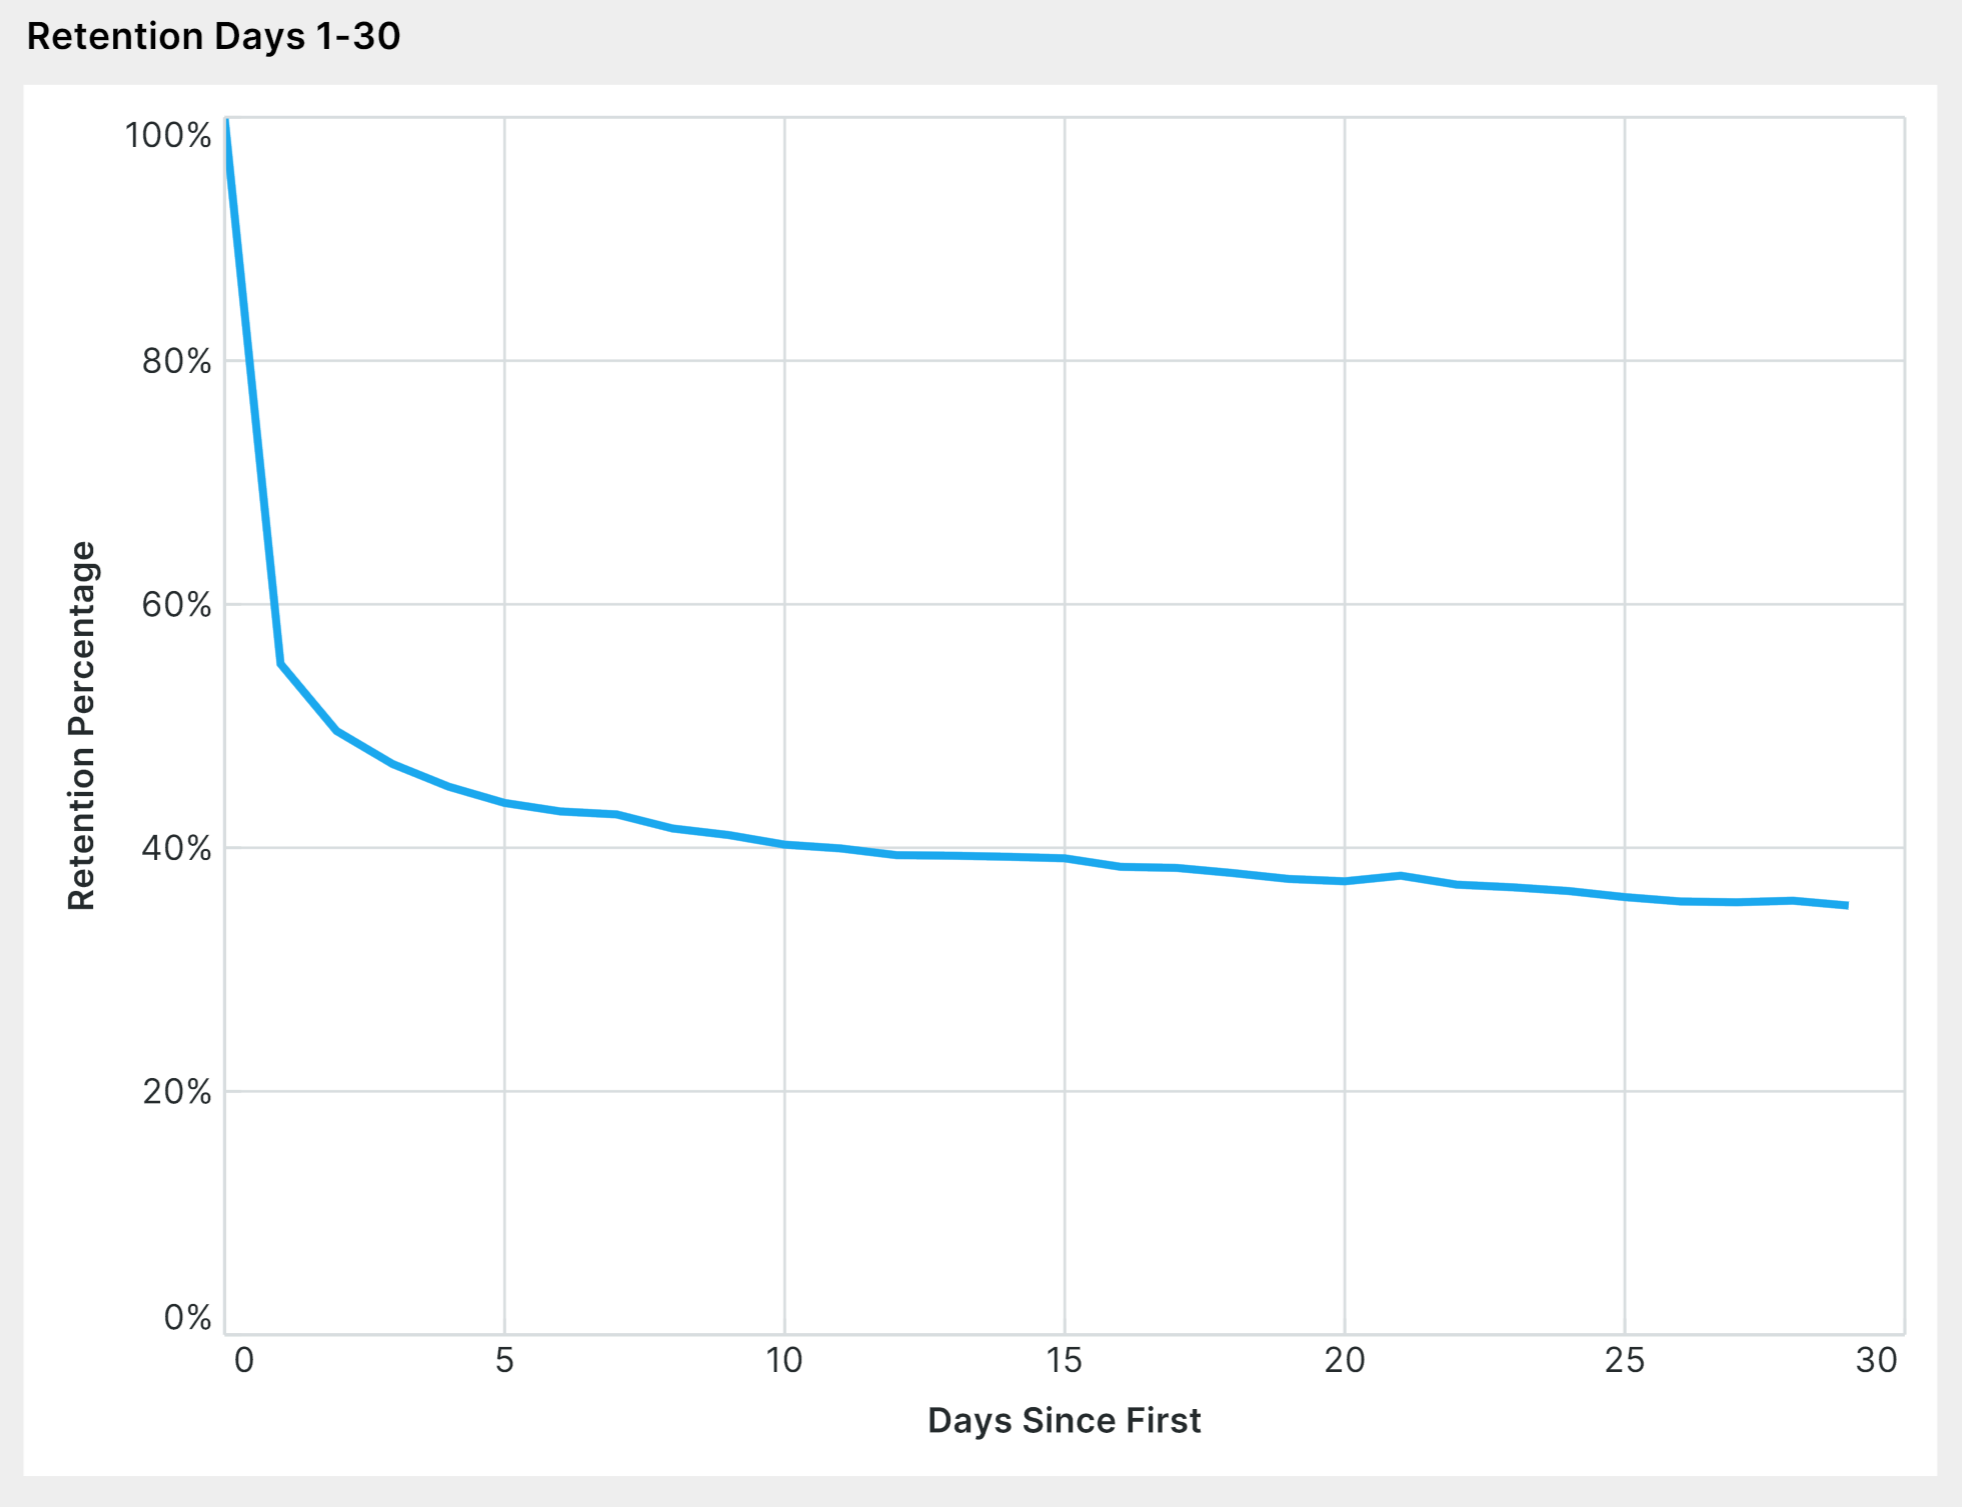
Image Credits: David K. Smith
After you’ve proven short-term traction, find signs it’ll be long term
A product that’s been on the market for six months or more should be measuring all of the above and also putting together cohort retention curves.
Essentially, that means following how every user who started in a given month is doing over time — each of those months represents a cohort. Of the, say, 1,000 users who started in January, 100% won’t stick around. But, if by September, 40% of them are still using your product, those users are showing you that they find your product useful over a long time.
You want to see “flattening” retention curves for each cohort: User numbers will drop over time, but after a few months, they should plateau. This flattening is depicted in the chart below, where each line represents a cohort of users who started in the same month.
You should be retaining a meaningful percentage of those original users consistently. The benchmark for what is considered “good” varies depending on what type of customers you have. Enterprise customers on subscription plans should be stickiest, while consumers without subscriptions are less likely to stick around.
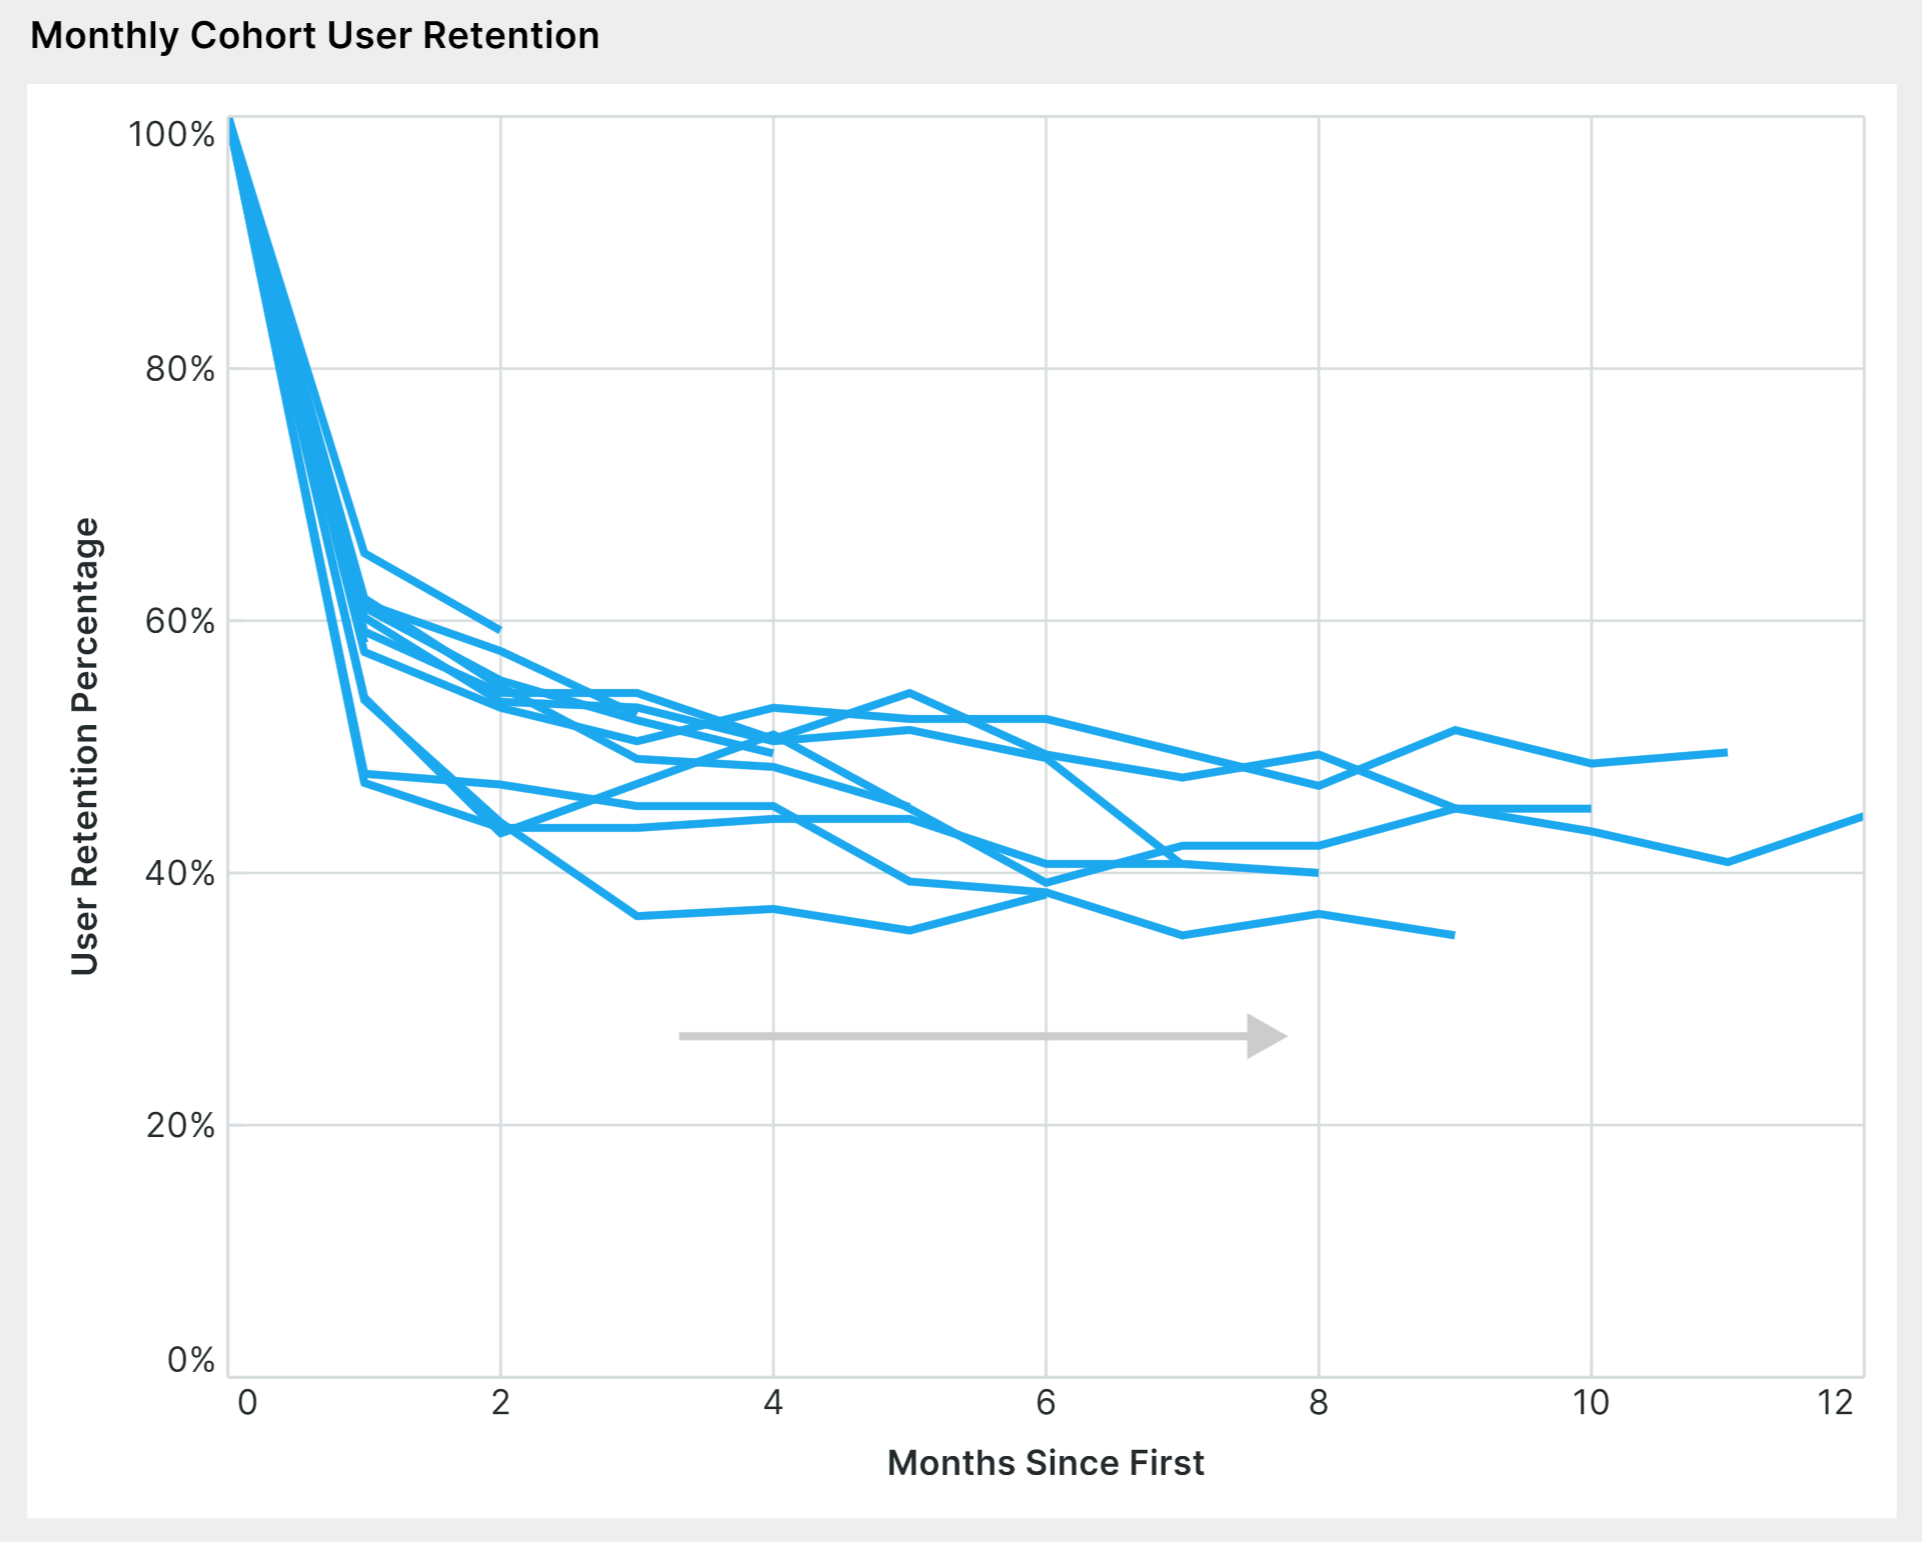
Image Credits: David K. Smith
Investors will want to see the degree to which those retention curves are flattening as evidence that your product is retaining users better. Investors emphasize retention because it is a foundation for efficient growth. After all, it’s much easier to grow monthly active users (MAU) if you don’t have to replace last month’s users with a completely new set of users.
Every stage of the fundraising journey involves building up as much evidence as you can to show investors that you have truly engaged users who are sticking around, and that all of those metrics are on the up. Investors need to see that you’re not being blindsided by easy wins that can go up in smoke within weeks but are using hard data to build a sustainable company that will endure, and thrive, with time.