
The rise in customer acquisition costs (CAC) is creating quite the dent in marketing budgets, placing marketing teams in a position where they have to do more with less.
When it comes to user acquisition campaigns, a few small fires need to be put out first. Many organizations’ issues stem from major premature decisions that are made based on incomplete data, and this is a problem that weighs more heavily on startups that sell to other businesses than those that sell to consumers.
For starters, B2B startups typically have longer funnels than their counterparts because their offerings often include freemium options and free trials. As a result, these startups don’t see many conversions within the first few weeks of acquiring new subscribers. That’s not to say there won’t be more conversions — B2B startups following a product-led growth model simply need more time.
Ultimately, marketing teams at such B2Bs end up scrambling to make major campaign decisions based on early CAC or return on ad spend (ROAS) metrics that rely on historical averages. They need a little extra help in the form of predictive marketing, of which some elements can easily be done in-house.
To help you better evaluate your campaigns early on, our data science team created an Ad Group Likelihood Simulator.
Marketers can use this tool to estimate the likelihood of a campaign’s ability to yield high ROAS over time simply by entering a few numbers.
As the name implies, marketers can use this tool to estimate the likelihood of a campaign’s ability to yield high ROAS over time simply by entering a few numbers.
How to use the simulator
Step 1
Based on your historical campaign data, fill in the quality group classification, which divides your campaigns into quality cluster groups 1-5, where 5 is the best quality (with the highest probability to convert) and 1 is the least favorable (lowest probability to convert).
Naturally, campaigns have a higher probability of belonging to the latter. If you don’t have this data available, ask your BI team to extract it for you by following the instructions below:
Choose the quality cluster group average conversions. Let’s assume you have the history of 500 ad groups and you are interested in conversions that happened within 12 months.
Option 1
Take all of your 500 ad groups and calculate the 10th, 30th, 50th, 70th and 90th percentiles of the 12-month conversion rate. These are the centers of your five cluster groups’ conversion rates.
Option 2
You know your marketing campaigns best and know the rules of thumb on what CR constitutes a terrible, bad, meh, OK or great group. Set the group threshold with that knowledge. For example, if you are a PLG freemium SaaS for teams and your 12-month average CR is 0.5%, you’ll probably want to go for 0.05%, 0.2%, 0.5%, 1% and 2%.
How likely is a campaign to belong to a certain quality group?
To calculate this:
- Associate each of your ad groups with one of those buckets by choosing a bucket with the closest conversion rate. For example, if a specific ad group has 0.3%, we associate it with the 0.2% bucket in option 2 above.
- Count the frequency of each cluster to get its probability. So if 200 of the 500 ad groups were associated with the 0.05% cluster, the probability of an ad group belonging to that cluster is:
200/500 = 40%
Note that with option 1, the probability for each cluster should be around 20%.
As you can see in the example below, when split into five quality groups, the probability of belonging to the best group (group 5) is 5% and 33% for the worst one (group 1).
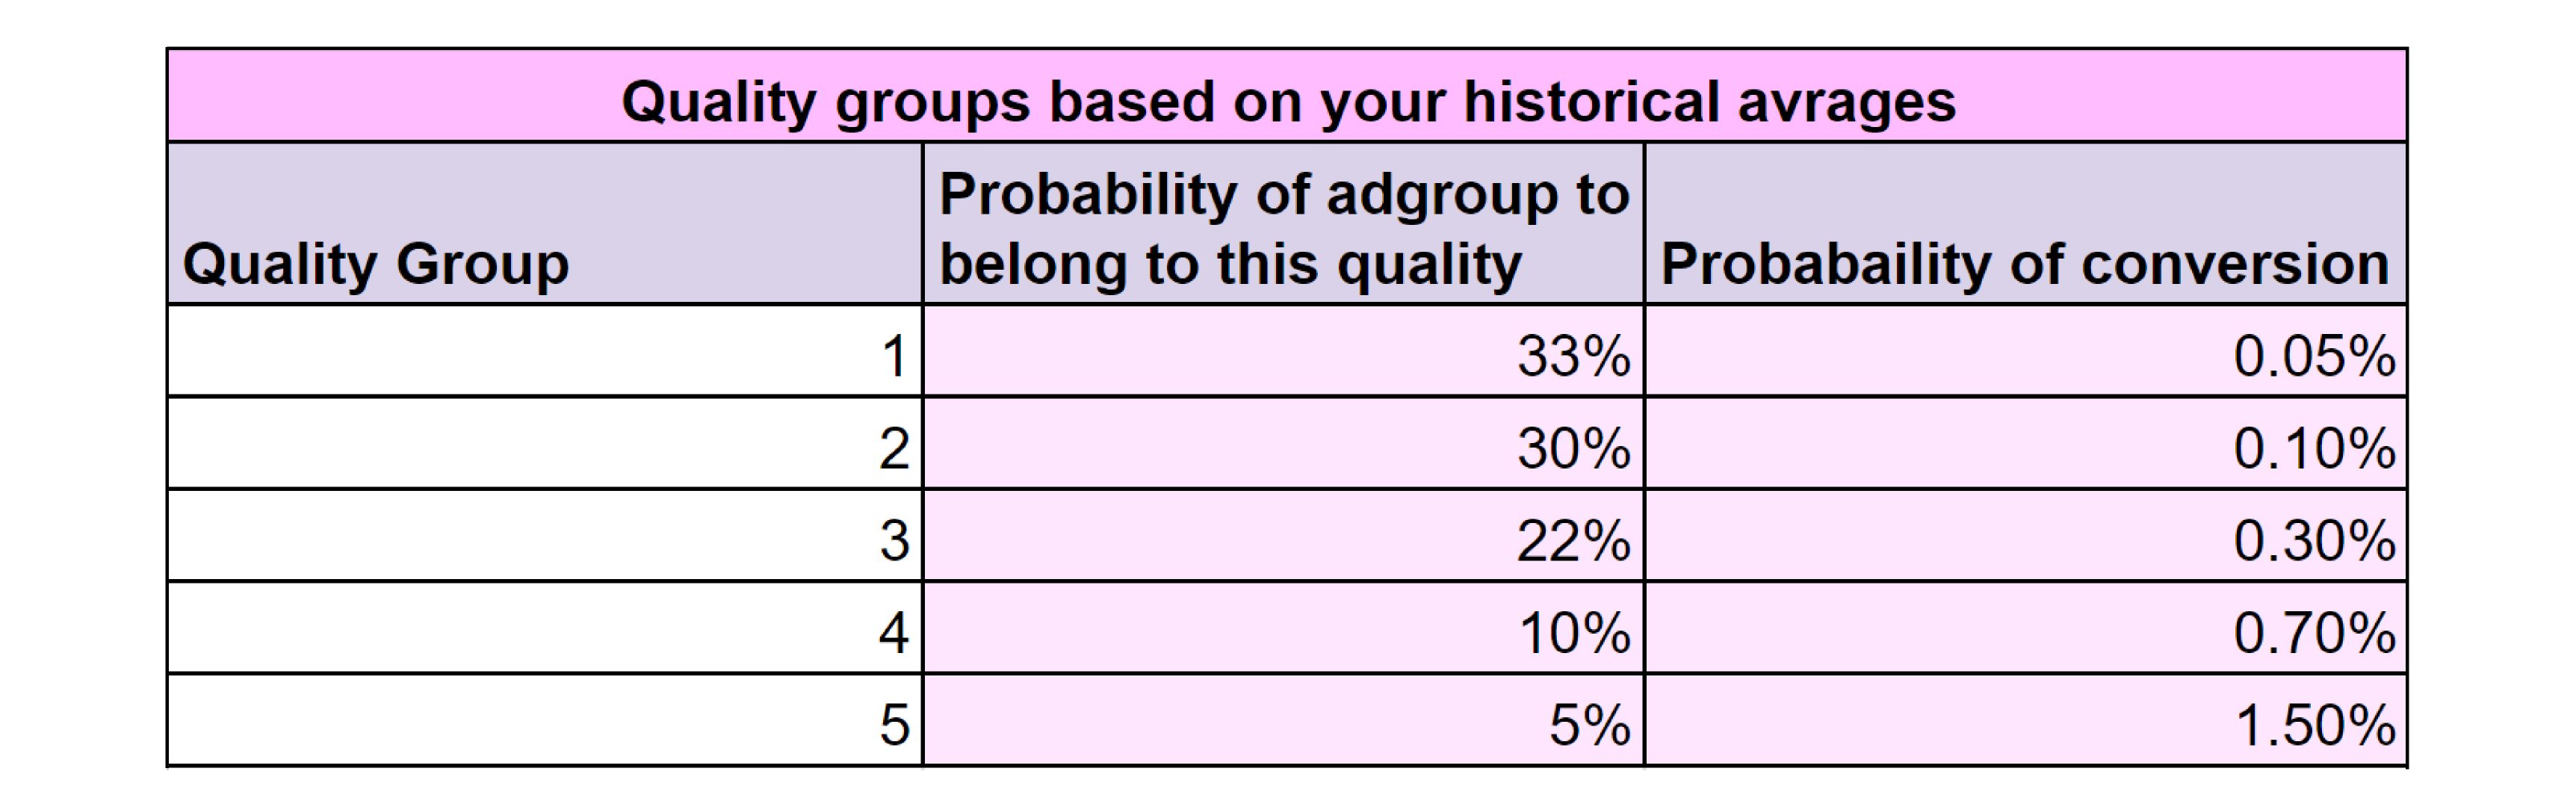
Image Credits: Voyantis
Step 2
Fill in the performance metrics to date of the specific campaign or ad group’s cohort. You’ll want to fill in the spend and the cost per subscriber.
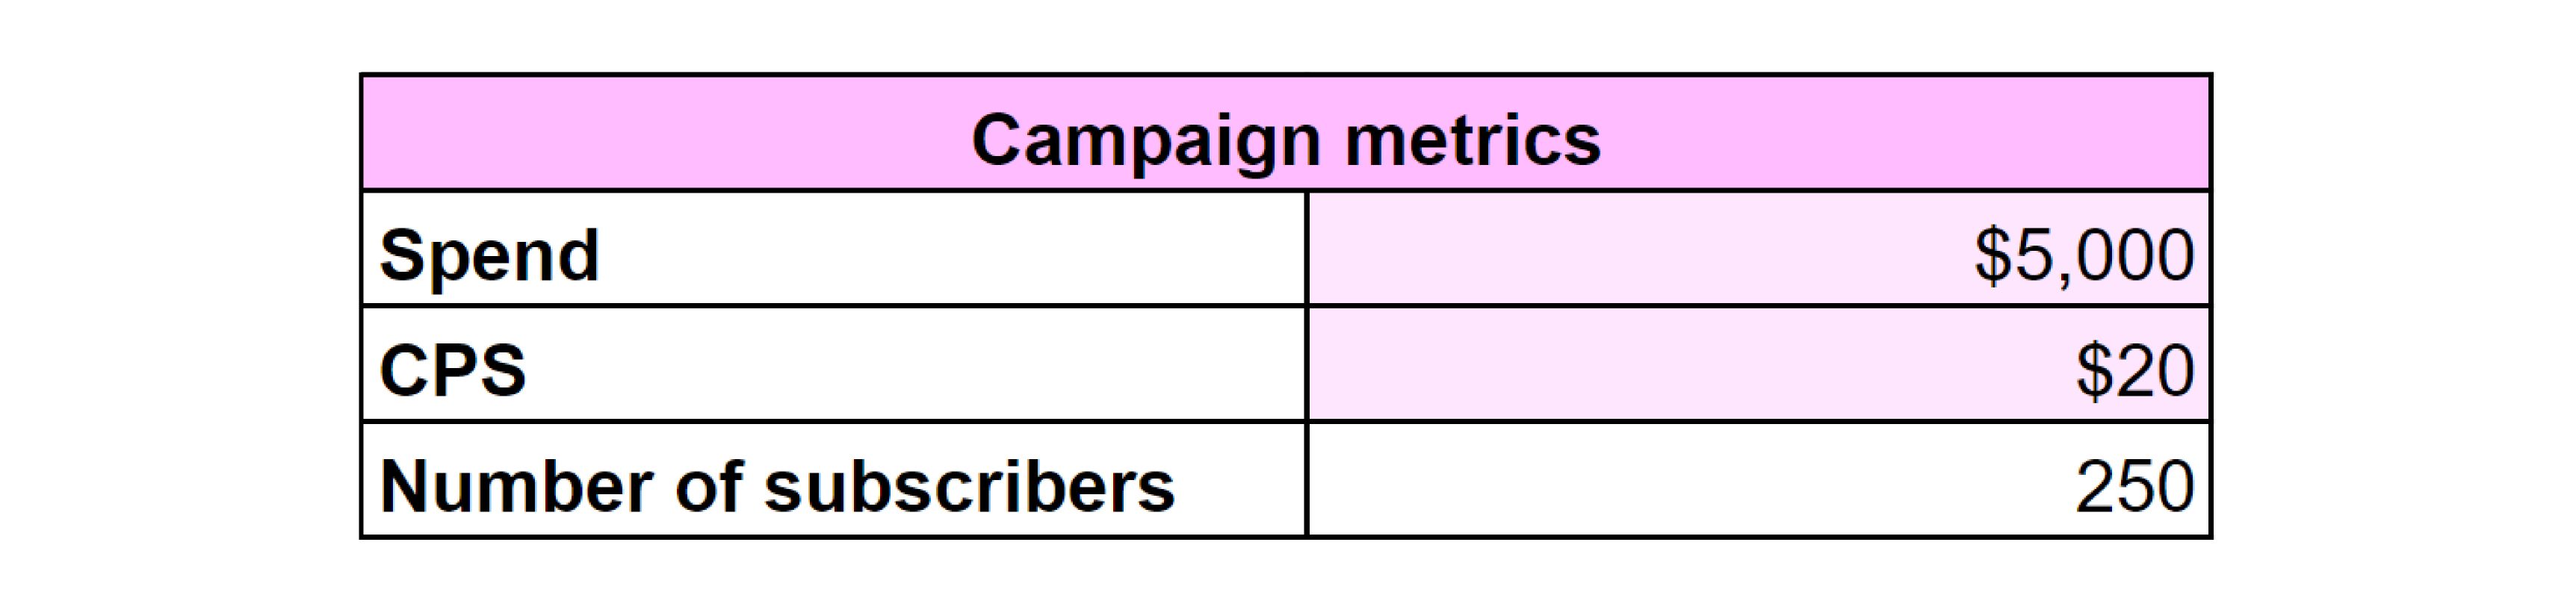
Image Credits: Shahaf Oshri / Voyantis
Step 3
This is where the magic begins and you can sit back and better evaluate the chances of your campaign belonging to each one of the quality groups with consideration of the number of conversions the campaign generated and observed to date.
In our example (using the data we entered in steps 1 and 2), if the ad group generated two conversions to date, it’s most likely to belong to quality group 3 (40%!). If it generated three conversions, it will rank in group 4 (46%!).
As you can see (and as you know), every conversion counts!
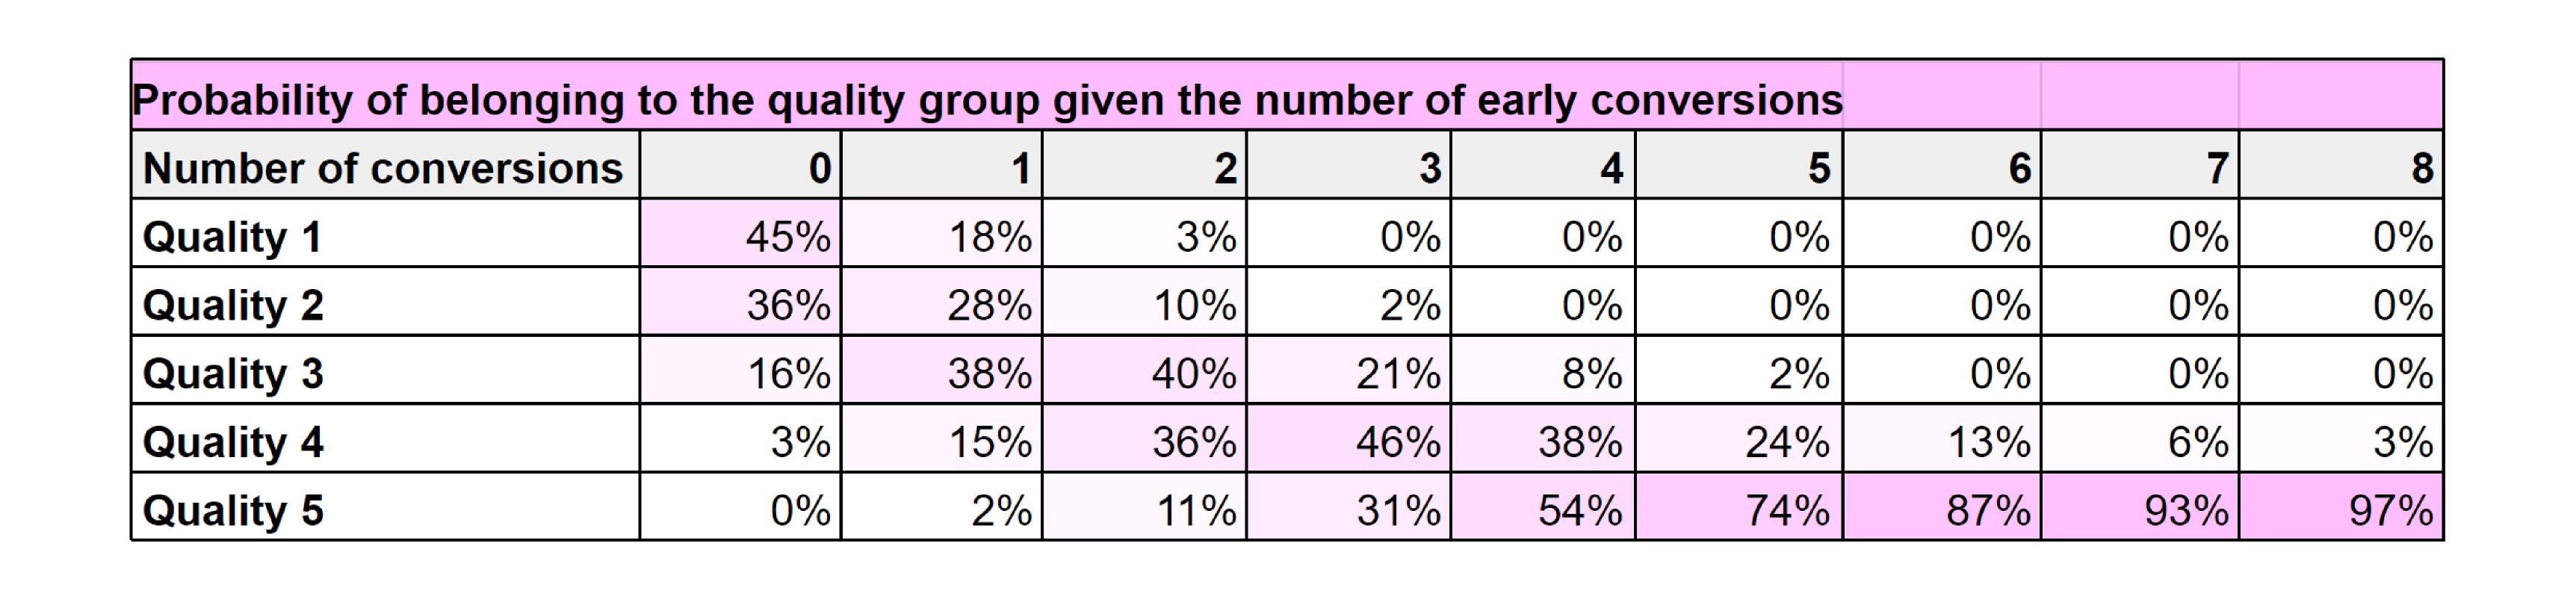
Image Credits: Shahaf Oshri / Voyantis
A few words about the simulator
We created this simulator because we understand that making decisions based on a small number of subscriptions in a cohort is extremely sensitive to every additional subscription.
This means that one simple subscription in a cohort that spent $5,000 might doom or elevate a campaign or ad group incorrectly, and that can happen too frequently.
We wanted a tool that provides a clearer, more continuous and less “quantized” decision-making mechanism. We essentially used a Bayesian modeling approach. This employs conditional probabilities to calculate the maximum likelihood candidate of the real CR/quality of the media source so we can decide how much to bid on that source.
It’s your turn
All you have to do now is download the spreadsheet, make a copy and follow the instructions we laid out above.