
Less than 24 hours ago, TechCrunch took a look at a collection of data on the market for non-fungible tokens (NFTs). Our goal was to better understand the level of demand for NFTs in light of the number of recent funding rounds at startups that deal with the creation, trading or monetization of the digital signatures
Given a general decline in trading volume for a host of assets — blockchain-based and otherwise — it wasn’t a massive surprise to discover that NFT sales volumes are also falling. Not to zero, mind, but materially as the crypto market itself resets during one of its regular downturns. Much like the larger economic business cycle, the crypto market has its own gyrations between periods of optimism and pessimism.
The Exchange explores startups, markets and money.
Read it every morning on TechCrunch+ or get The Exchange newsletter every Saturday.
After we published that piece, however, some folks reached out suggesting that we were not looking at the right metrics to back our claim that the NFT slump was real. So, let’s take another look.
 There are a few ways to measure the health of any market. One way is total sales by unit volume, which was the method we chose yesterday. Another way is to track how value is being conserved by individual units — for example, in the stability of floor prices for popular NFT sets. You could also track the total value of traded assets instead of their unit volume.
Let’s add the latter two to our analysis to see if we were ignoring illuminating data, and therefore being accidentally glib yesterday. To work!
NFT metrics, part two
The Block, a publication and data source, provides lots of information relating to NFT sales, sorting by category, transactions, chain and more. The Block also has a dataset pertaining to traded value. Using the same year-to-date time frame that we did yesterday, here’s how the publication tracks the trade volume of NFTs, or the dollar value of NFT trades:
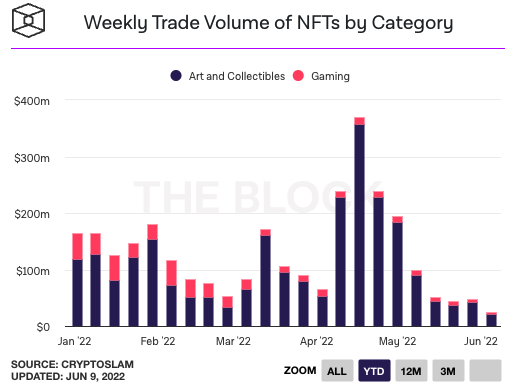
Image Credits: The Block Data
Sharp-eyed readers will note that this chart supports our position from yesterday that there has been a general decline in NFT trading since the start of the year. That said, there’s a spike in the April/May time frame that sticks out compared to our chart from yesterday. What drove it? The Yuga Labs Otherdeed sale, it appears, which accounted for nine-figures worth of dollar volume.
I wanted to better understand those few bars in the chart, so I pulled a related dataset from NonFungible, another data source on the crypto market.
The following chart contrasts the two types of data that we’ve looked at thus far, namely the number of NFT sales (the red line) and the value of those trades (the white line). Note, however, that the following chart is for a one-year time frame instead of merely measuring from the start of the year (NonFungible lacks that charting option):
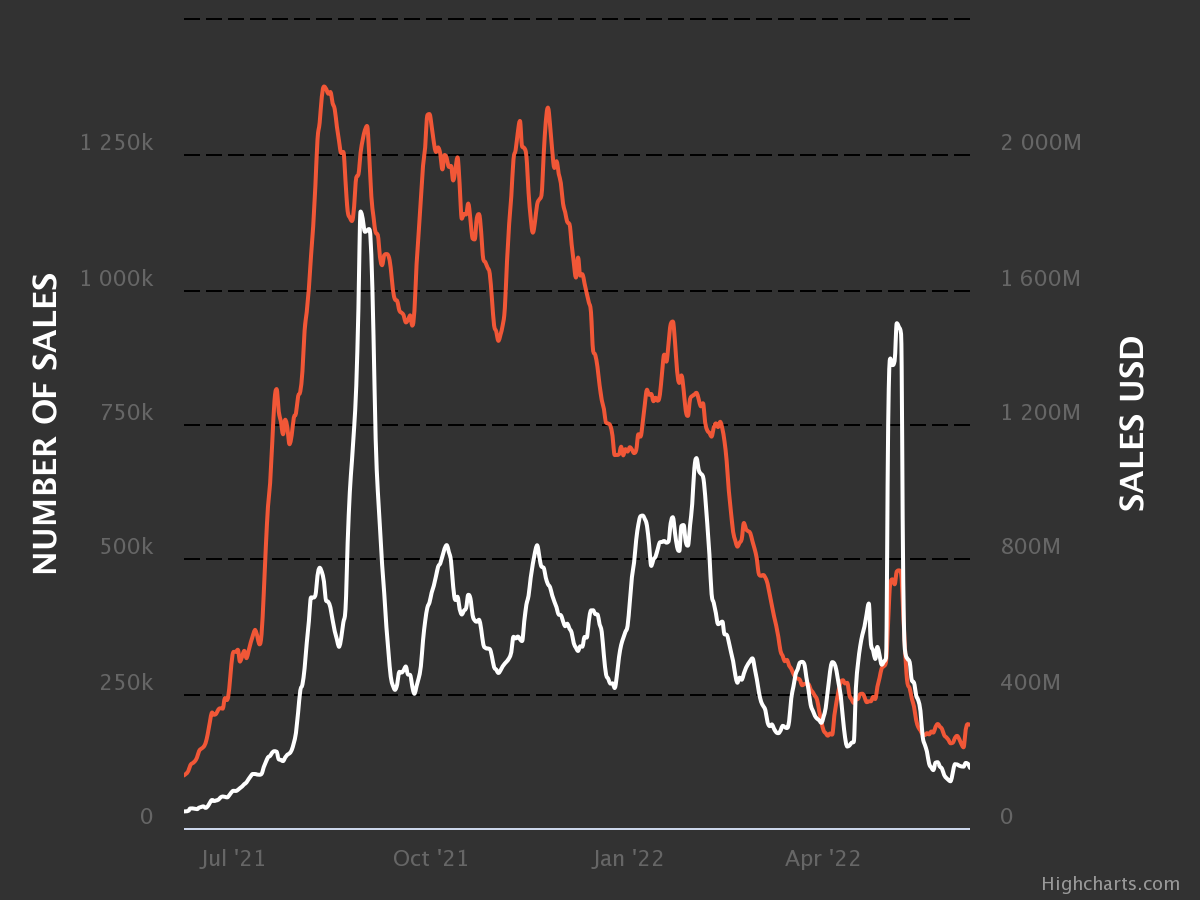
Image Credits: NonFungible
Directionally, this matches what we saw from The Block, and a general decline is visible in both trading volume and trading value, with an uptick around the time of the Yuga Labs sales.
At this juncture, we could argue that our original point stands, with the added context that one particular NFT-focused company — Yuga Labs, backed, of course, by crypto kingmaker a16z — did manage to buck the trend for a period of time.
But let’s keep going. We’ll now look into the extent to which some well-known NFTs are holding on to value. How are some major NFT sets performing in terms of their floor prices? Thanks to CoinGecko data, a few more data points:
- Bored Ape Yacht Club floor price peak: ~$420,000 (~154 ETH), set on May 1, 2020.
- Bored Ape Yacht Club floor price today: $168,500 (~93.88 ETH).
- Percentage change in dollar-term: Down about 60%.
- Percentage change in eth terms: Down about 39%.
The difference between the two percentage declines comes from changes in the value of ETH, the token associated with the Ethereum blockchain, historically the most popular location for NFT activity.
The floor value of Otherdeeds, the NFT that is part of the larger Bored Ape universe and the driver of the boom in activity we saw above, has also come down. From around 5 ETH, a little more than $14,000 back at the start of May, to around 2.64 ETH today, or $4,739, again per CoinGecko.
This is not to say that there aren’t some high points among the generally downward-pointing charts. For example, the goblintown.wtf NFT collection floor price has risen since its late-May introduction, albeit it’s retreated a little in the last few days. And the ShitBeast project has shown that there is still demand for the sort of whimsy that we have seen at times from the world of NFTs.
That said, the data doesn’t appear to indicate that there is a more attractive way to view NFT activity today. It is, by a number of measuring methods, depressed at the moment. This meets our view of a slump.
Bear in mind that slump does not mean utterly fucked for all time. It means that presently, the NFT market is trending smaller and less active. That may change, and when it does, so too will our headlines.