
Churn gets a lot of bad press. Yes, it is complex and confusing, but as a metric, it is helpful.
In the early stages of building a company, churn gives you quick feedback, which other metrics seldom do. Studying churn lets you run tests on your platform and get feedback in a few days or months.
In this post, we dive deep into churn. First, we answer a few key questions: What is churn? What are its different types? And how can it be negative?
Then, we dive into churn benchmarks. We analyze anonymized and aggregated data to answer the question: What is a good churn rate?
So without any further ado, let’s dive in.
What is churn?
Churn is an indicator of the health of your existing subscriber base. In simple terms, churn is the rate at which your SaaS business loses customers or revenue.
From a high level, you can look at churn in two ways:
- Customer churn — measures the rate at which customers are leaving your SaaS business.
- Revenue churn — measures the rate at which revenue is leaving your SaaS business.
Negative net MRR churn is akin to SaaS nirvana, because with each passing month, your existing subscribers become more and more valuable.
Why look at customer and revenue churn separately?
Depending on the revenue concentration, customer churn can be different from revenue churn. Hence, it’s good to look at both numbers.
For example, imagine you’re running a SaaS business with three customers: A, B and C. Their monthly recurring revenue (MRR) is $20, $30 and $50, respectively (for a total MRR of $100).
Now, one day, C decides to cancel their subscription and churn. So when you calculate your customer churn rate for the month, it will be 33% (as one of three customers churned). But if you calculate your revenue churn rate, it will be 50%. This is because C made up 50% of your MRR.
Types of revenue churn
Let’s dig a little deeper into revenue churn. You can calculate revenue churn in two different ways:
- Gross basis — This is called gross MRR churn because it only takes into account the MRR lost (and not MRR gained) from your existing customers. As a reminder, you lose MRR from your existing customers via both churn and downgrades.
- Net basis — This is called net MRR churn because you net the MRR lost and gained from your existing subscriber base. So you lose MRR via churn and downgrades, but you also gain MRR via expansion and reactivation. Net MRR churn gives you a more holistic picture of the state of your subscriber base.
Here’s how you calculate your gross and net MRR churn rates:
- Gross MRR churn rate — (sum of churn and contraction MRR) / (MRR at start of period).
- Net MRR churn rate — (sum of churn and contraction MRR – sum of expansion an reactivation MRR) / (MRR at start of period).
How can churn be negative?
If you spend a little more time thinking about the churn formulas, you can infer two things:
- By definition, gross MRR churn will always be higher than net MRR churn. This is because gross MRR churn only takes into account the MRR lost, while net MRR churn also takes into account MRR gained.
- Net MRR churn can be negative. Net MRR chain takes into account both the MRR you lost and gained from existing subscribers. If the MRR gained from existing customers (expansion + reactivation) exceeds the MRR lost (churn contraction), your net MRR churn rate will be negative.
Why is net MRR churn rate called “SaaS nirvana?”
Negative net MRR churn is akin to SaaS nirvana because with each passing month, your existing subscribers become more and more valuable.
In a sense, your business can grow organically as you don’t need to spend any money on acquiring new customers.
What is a good monthly churn rate?
Now that you’ve got a good understanding of churn, let’s explore what makes a good monthly churn rate.
In this section, we’ll look at benchmarks for gross and net MRR churn split by MRR and ARPA bands.
(As a reminder, ARPA is the average revenue per account, i.e., average MRR across all your customers. It’s also known as ARPU or APRC.)
Why look at churn benchmarks by ARPA bands? Well, everything is sort of the same at a given ARPA value. The way you sell, the way you service and the way you retain all depend on your ARPA.
So for metrics such as churn, the best practice is to benchmark your startup in comparison to other businesses within the same ARPA band.
Gross MRR churn benchmarks
The chart below shows the median monthly gross MRR churn rate by ARPA bands. As you’ll notice, the higher the ARPA, the lower the gross MRR churn rate.
For example, companies with ARPA per month in the range of $0-$10 have a monthly gross MRR churn rate of 8.9%. As ARPA increases, the gross MRR churn rate decreases. It goes down to 2.5% for companies with an ARPA per month of over $500.
Why does the gross MRR churn rate decrease as ARPA increases? Because the customer profile changes. At higher ARPA, you start to sell to businesses rather than to consumers. Also, generally, customers make a more informed decision when buying a costlier product and hence churn less.
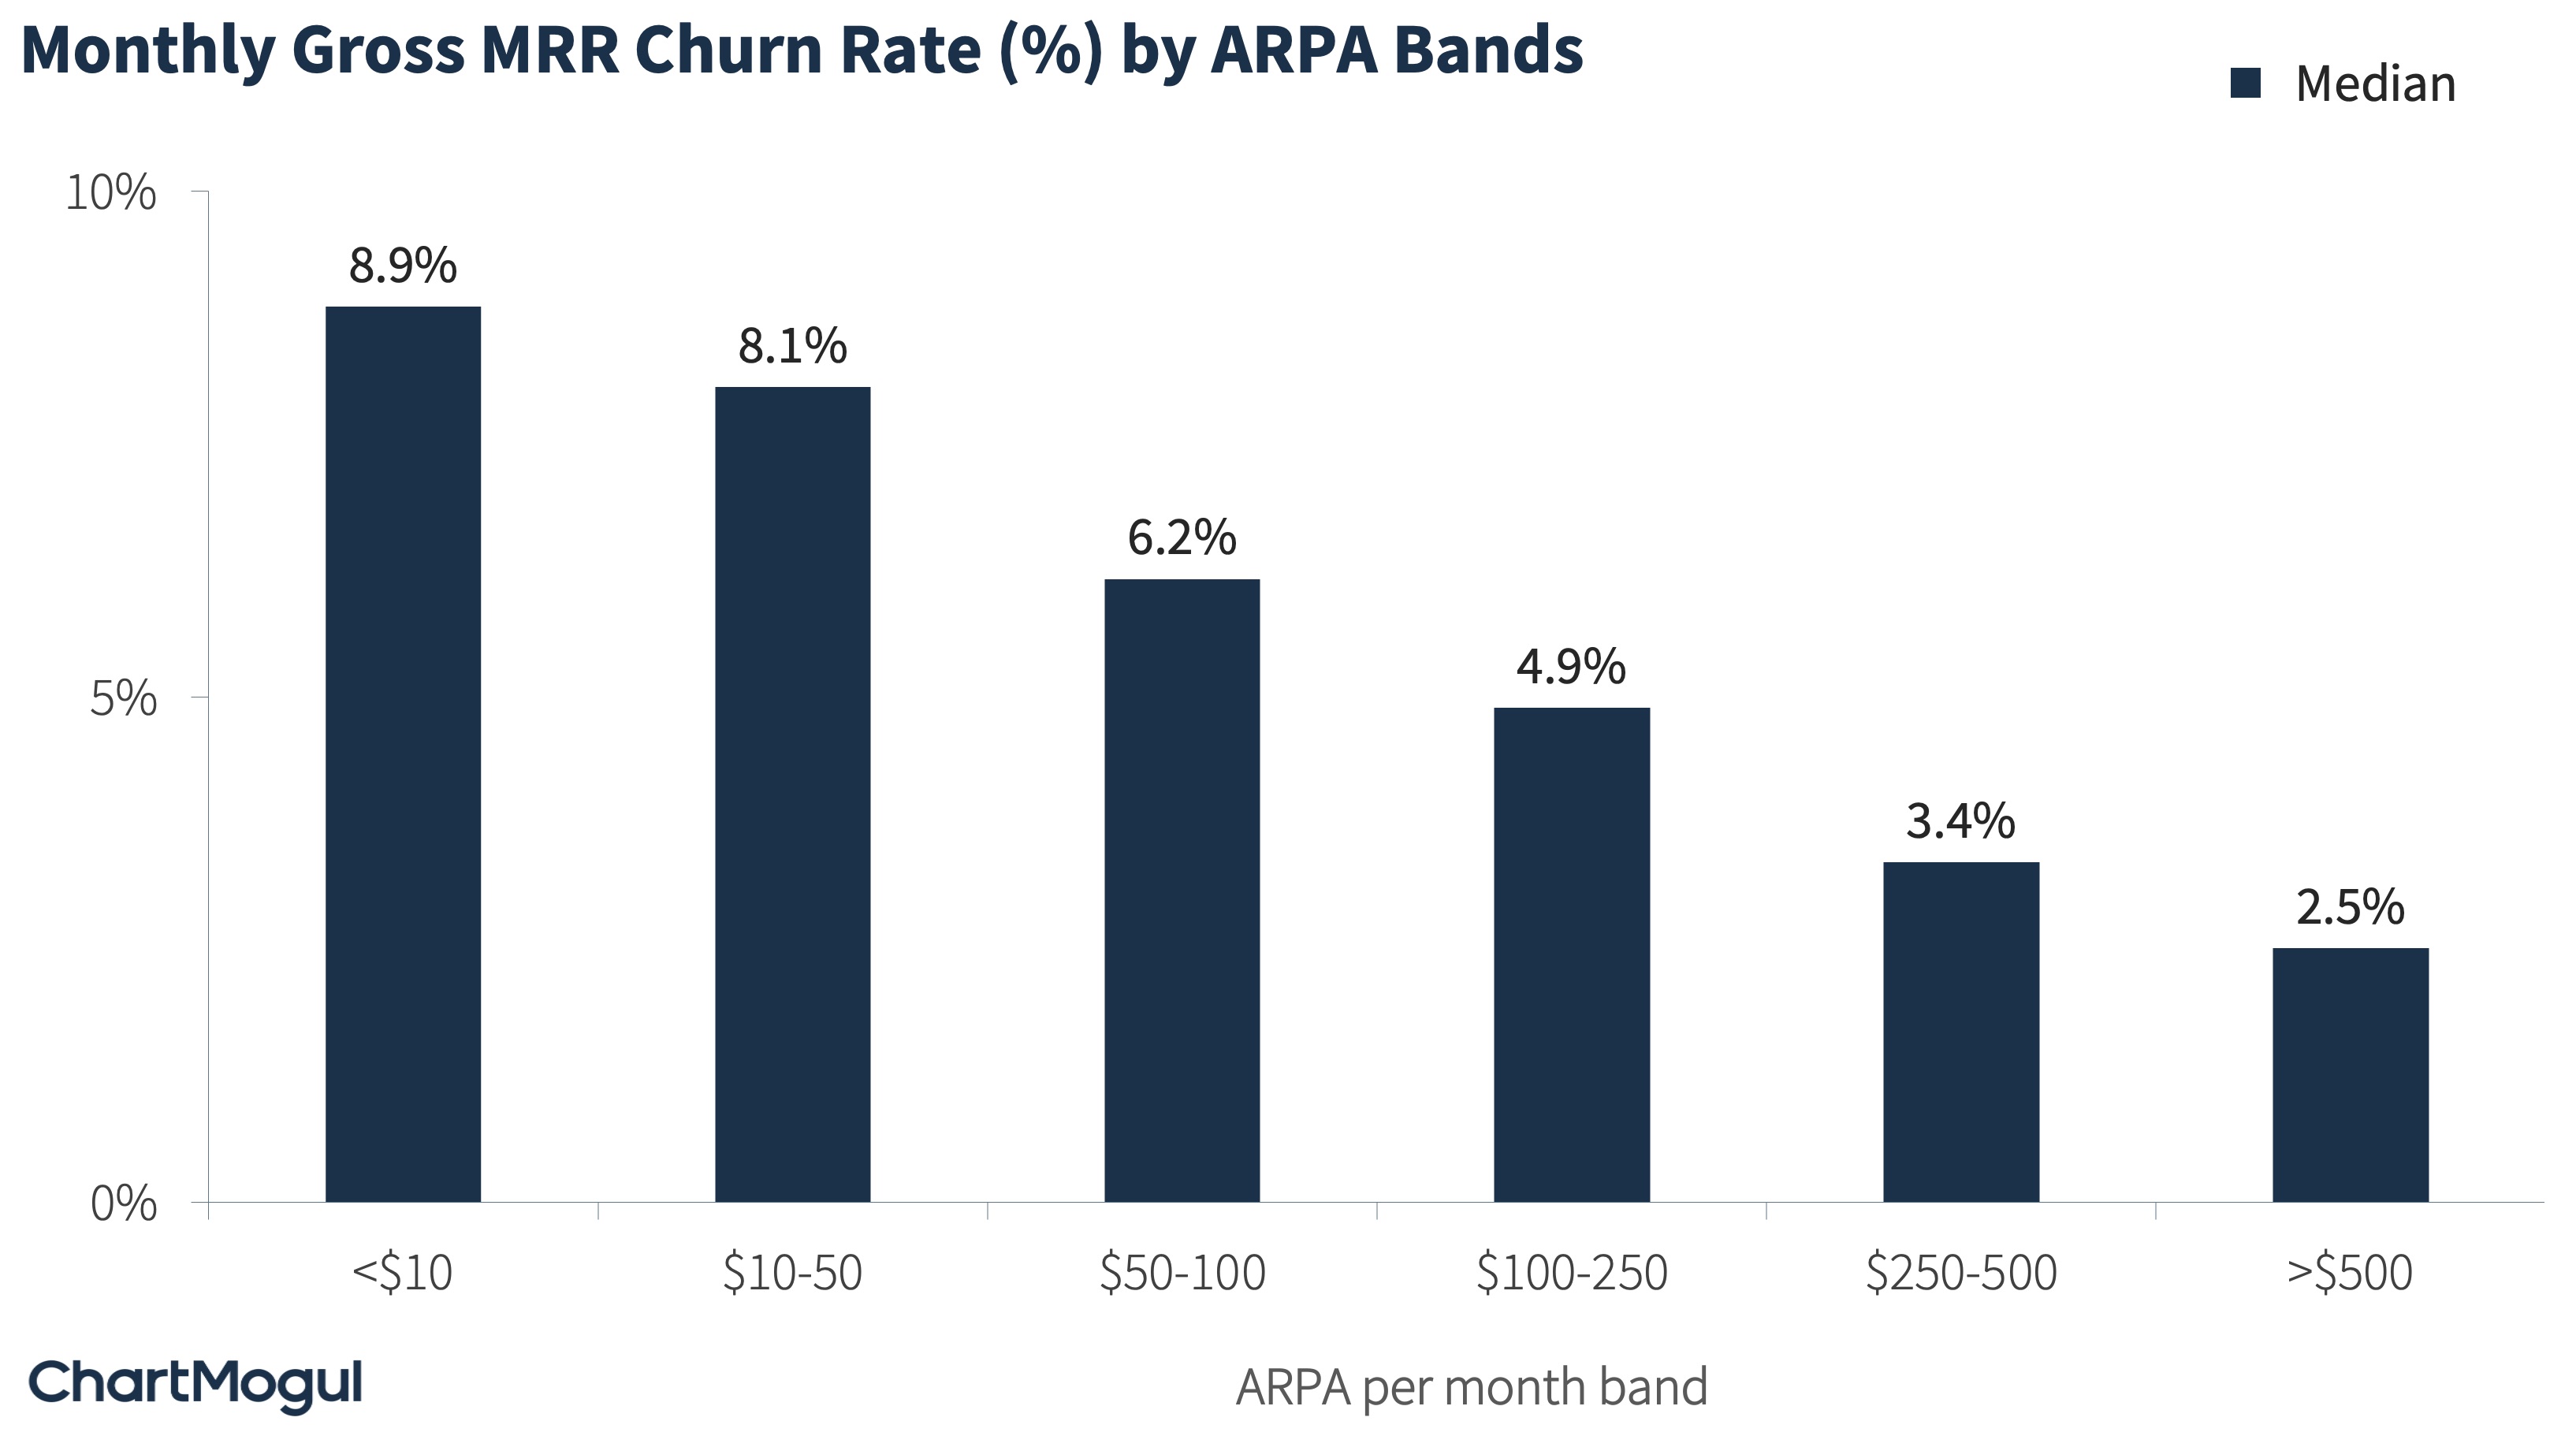
Image Credits: ChartMogul
In addition to the median, the chart below also shows the 25th and 75th percentiles of the gross MRR churn rate. You can use this data to benchmark your churn rate in comparison to your peers.
SaaS startups with ARPA of less than $100 should target a monthly gross MRR churn rate of under 3.5%, and those with ARPA of more than $100 should target a monthly gross MRR churn rate of under 2.5%.
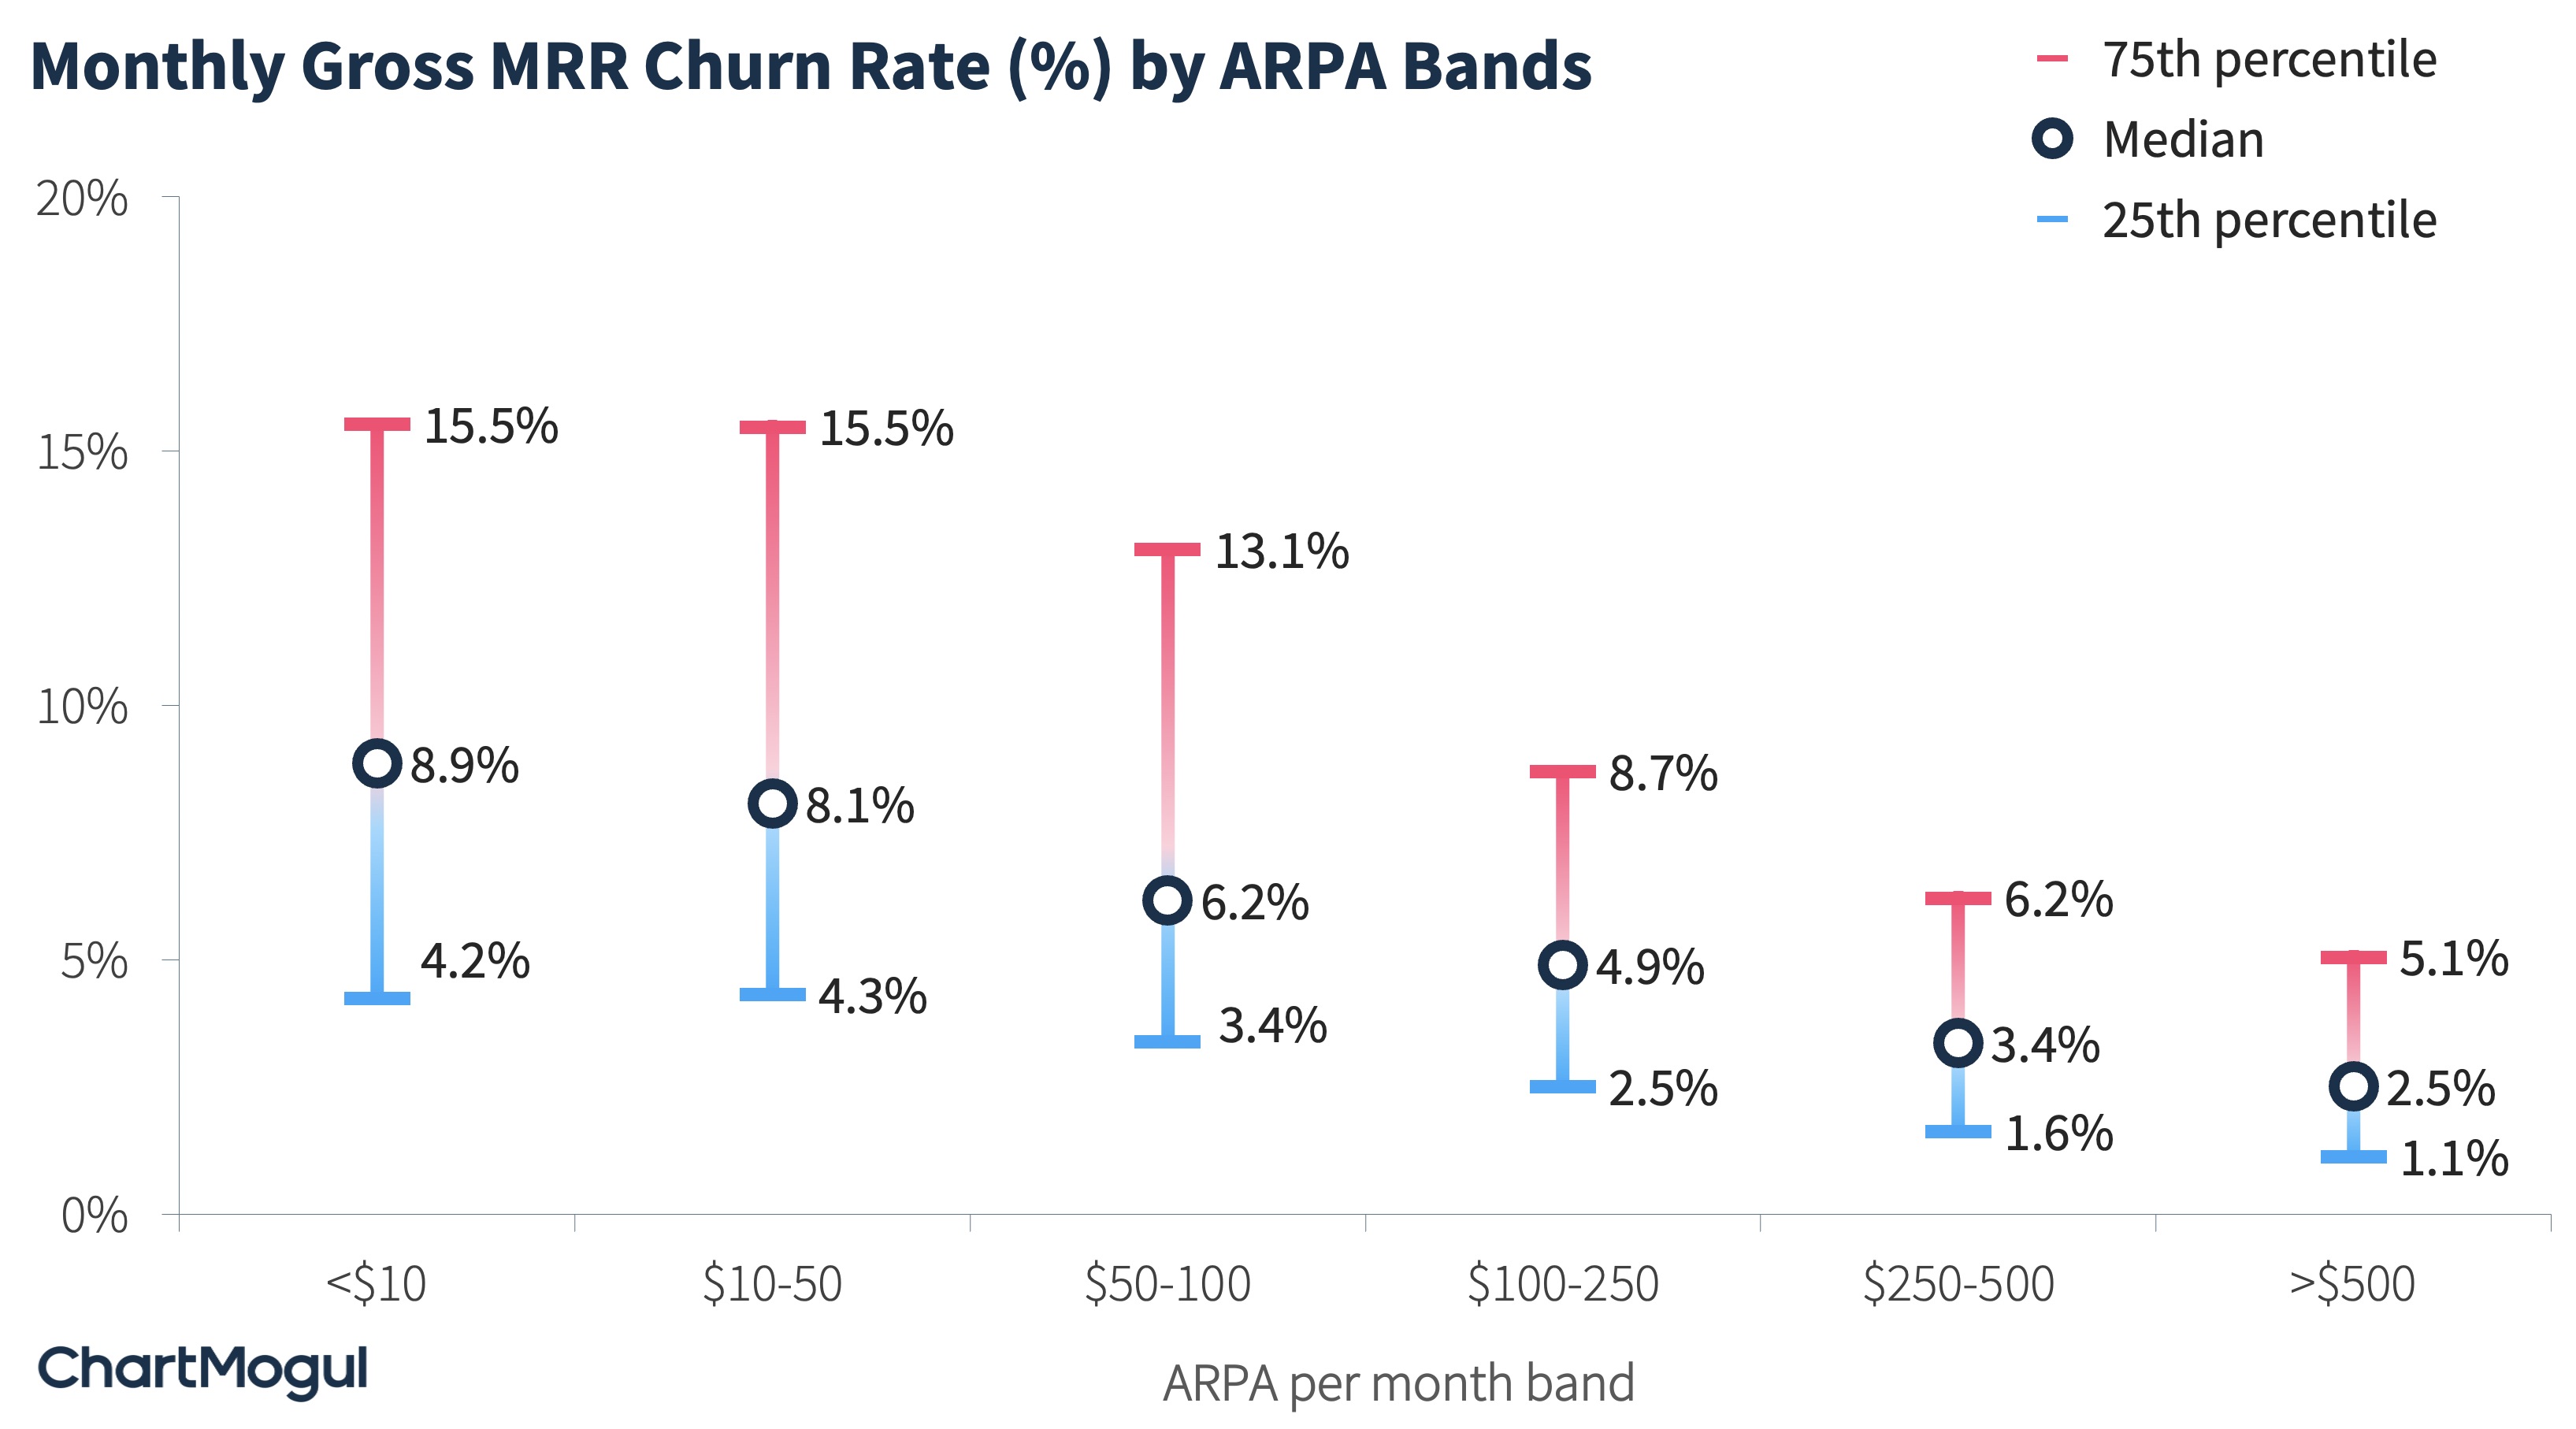
Image Credits: ChartMogul
Now let’s move on and look at the median gross MRR churn rate split by MRR bands.
At the early stages of growth (less than $10,000 MRR), the median monthly gross MRR churn is high at 8.6%. As companies grow, find product-market fit and home into their customer segment, the churn reduces to about 4%-5% per month. It then stabilizes at that level and doesn’t reduce even when a company grows.
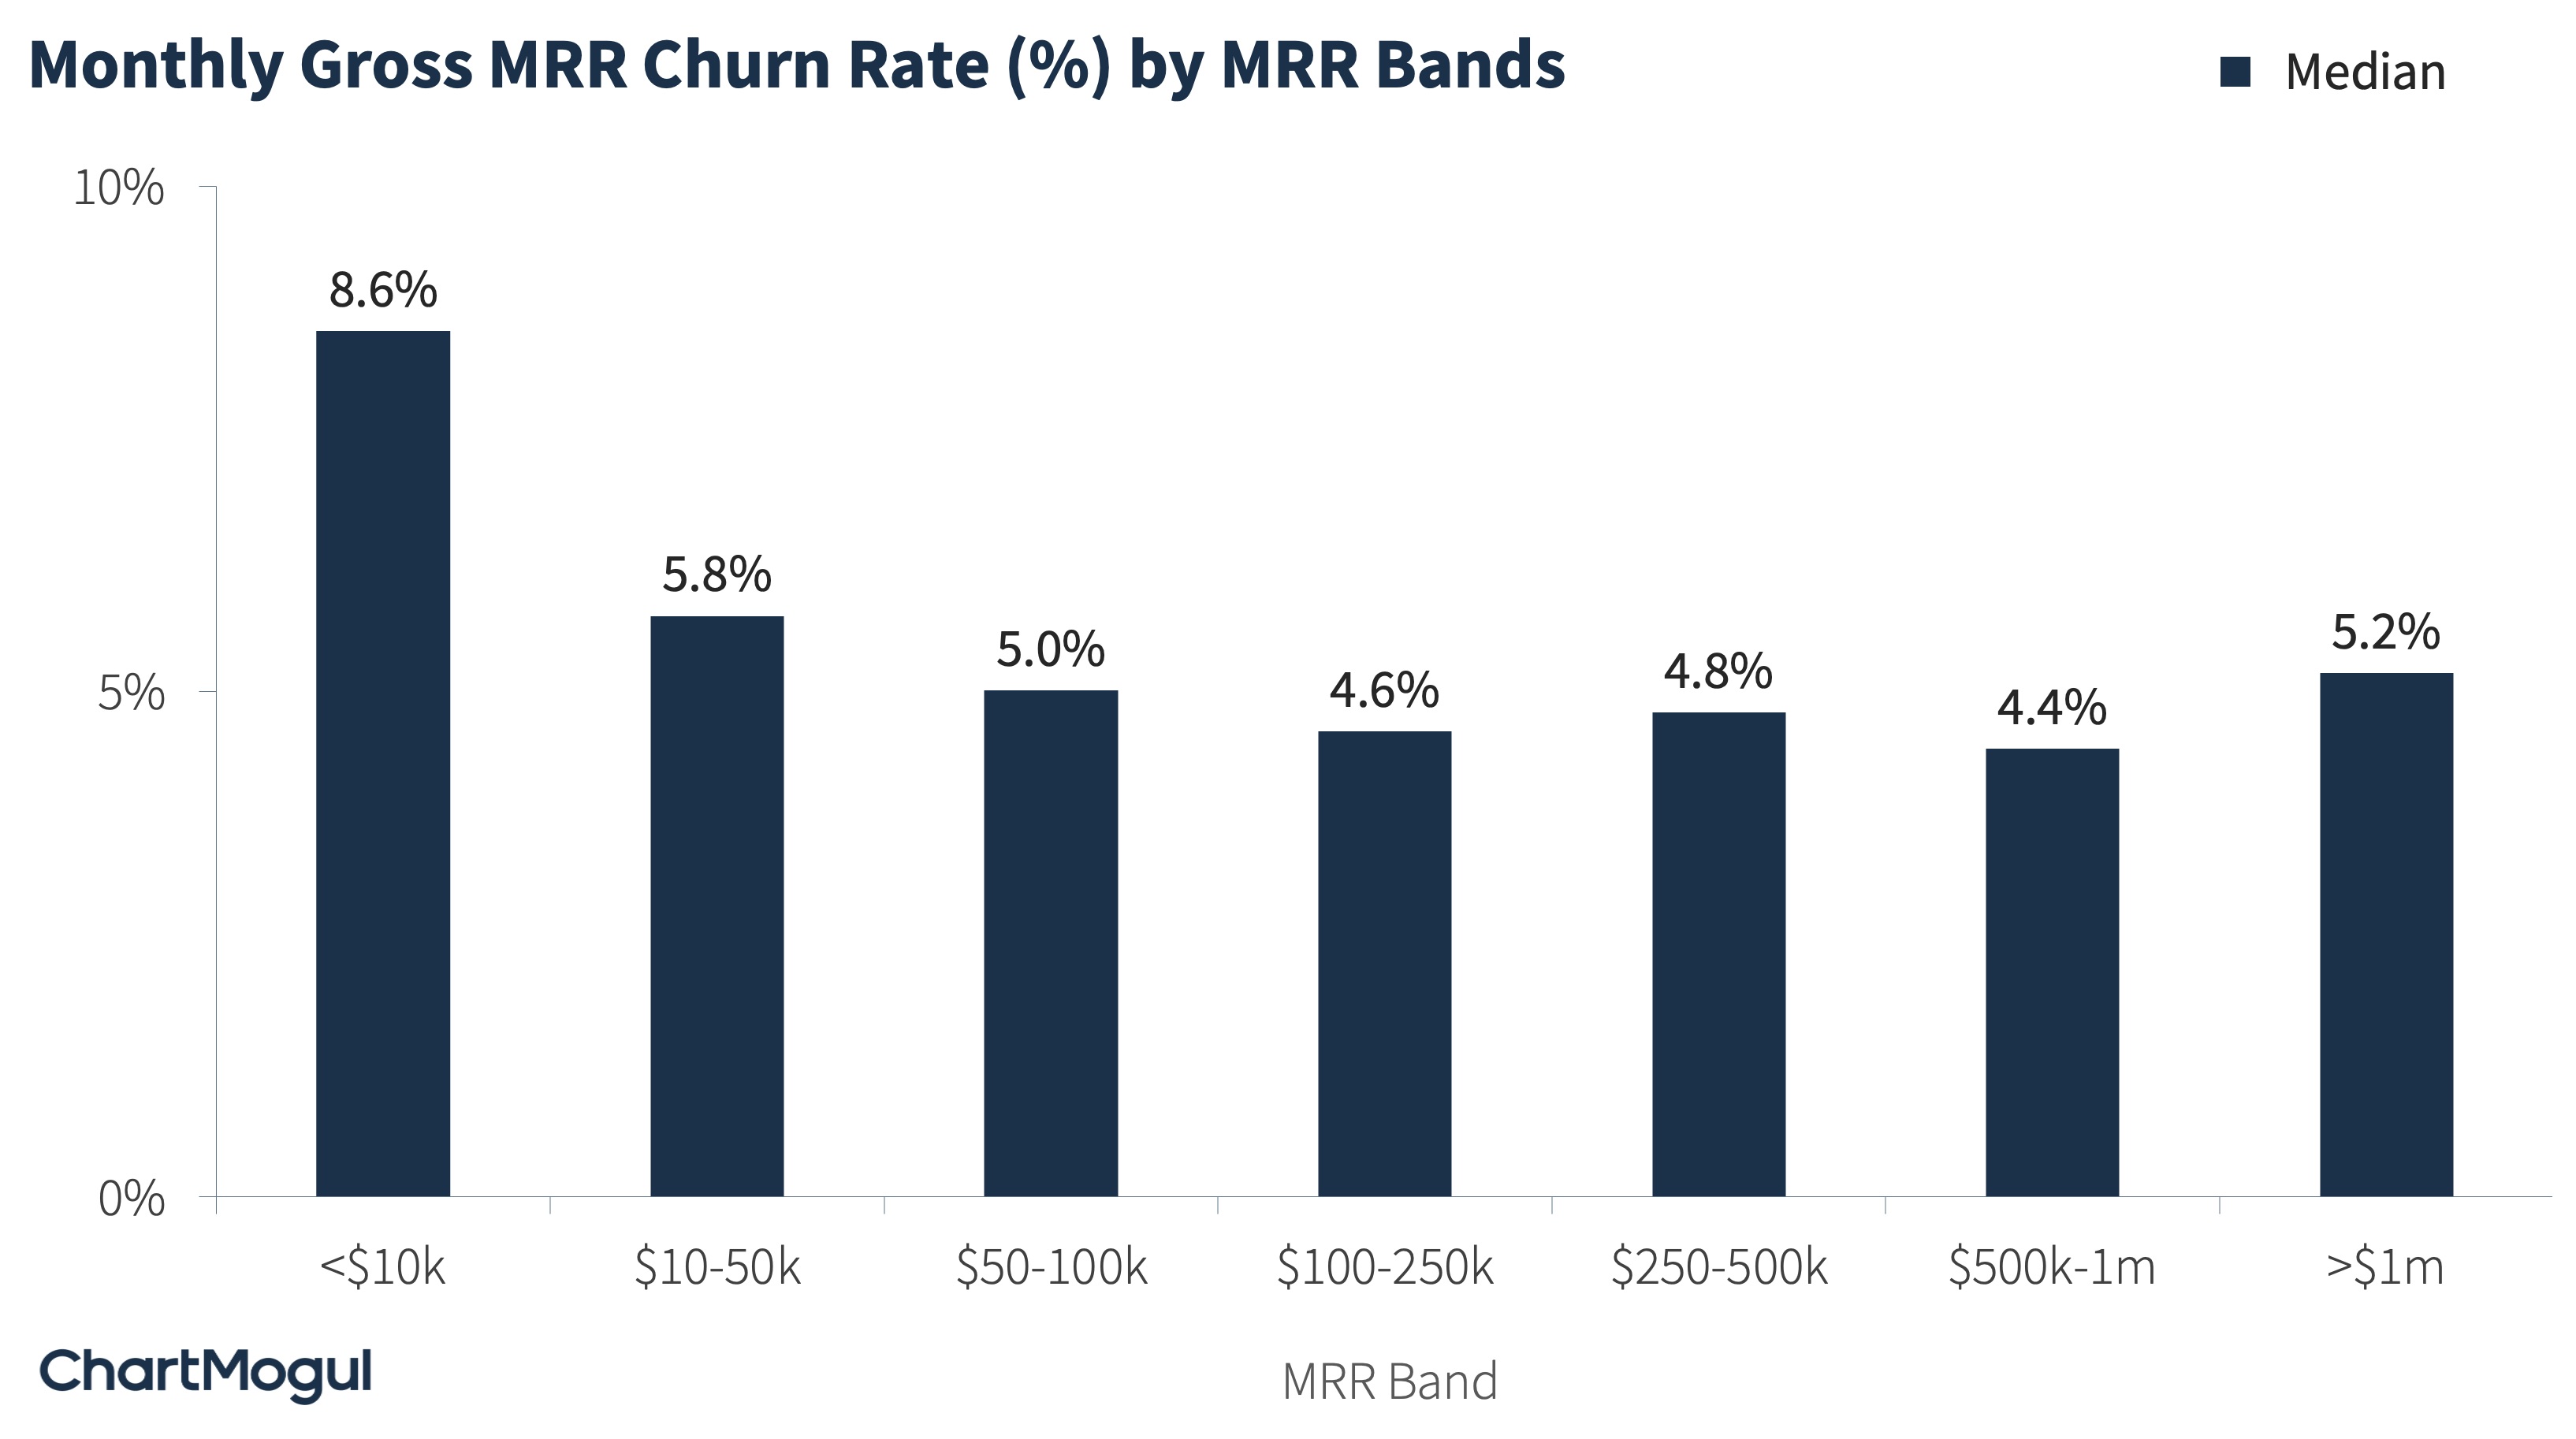
Image Credits: ChartMogul
In addition to the median, the chart below also shows you the 25th and 75th percentiles of the gross MRR churn rate by MRR band.
The best companies at any stage of their growth should target a gross MRR churn rate of less than 2.5% per month.
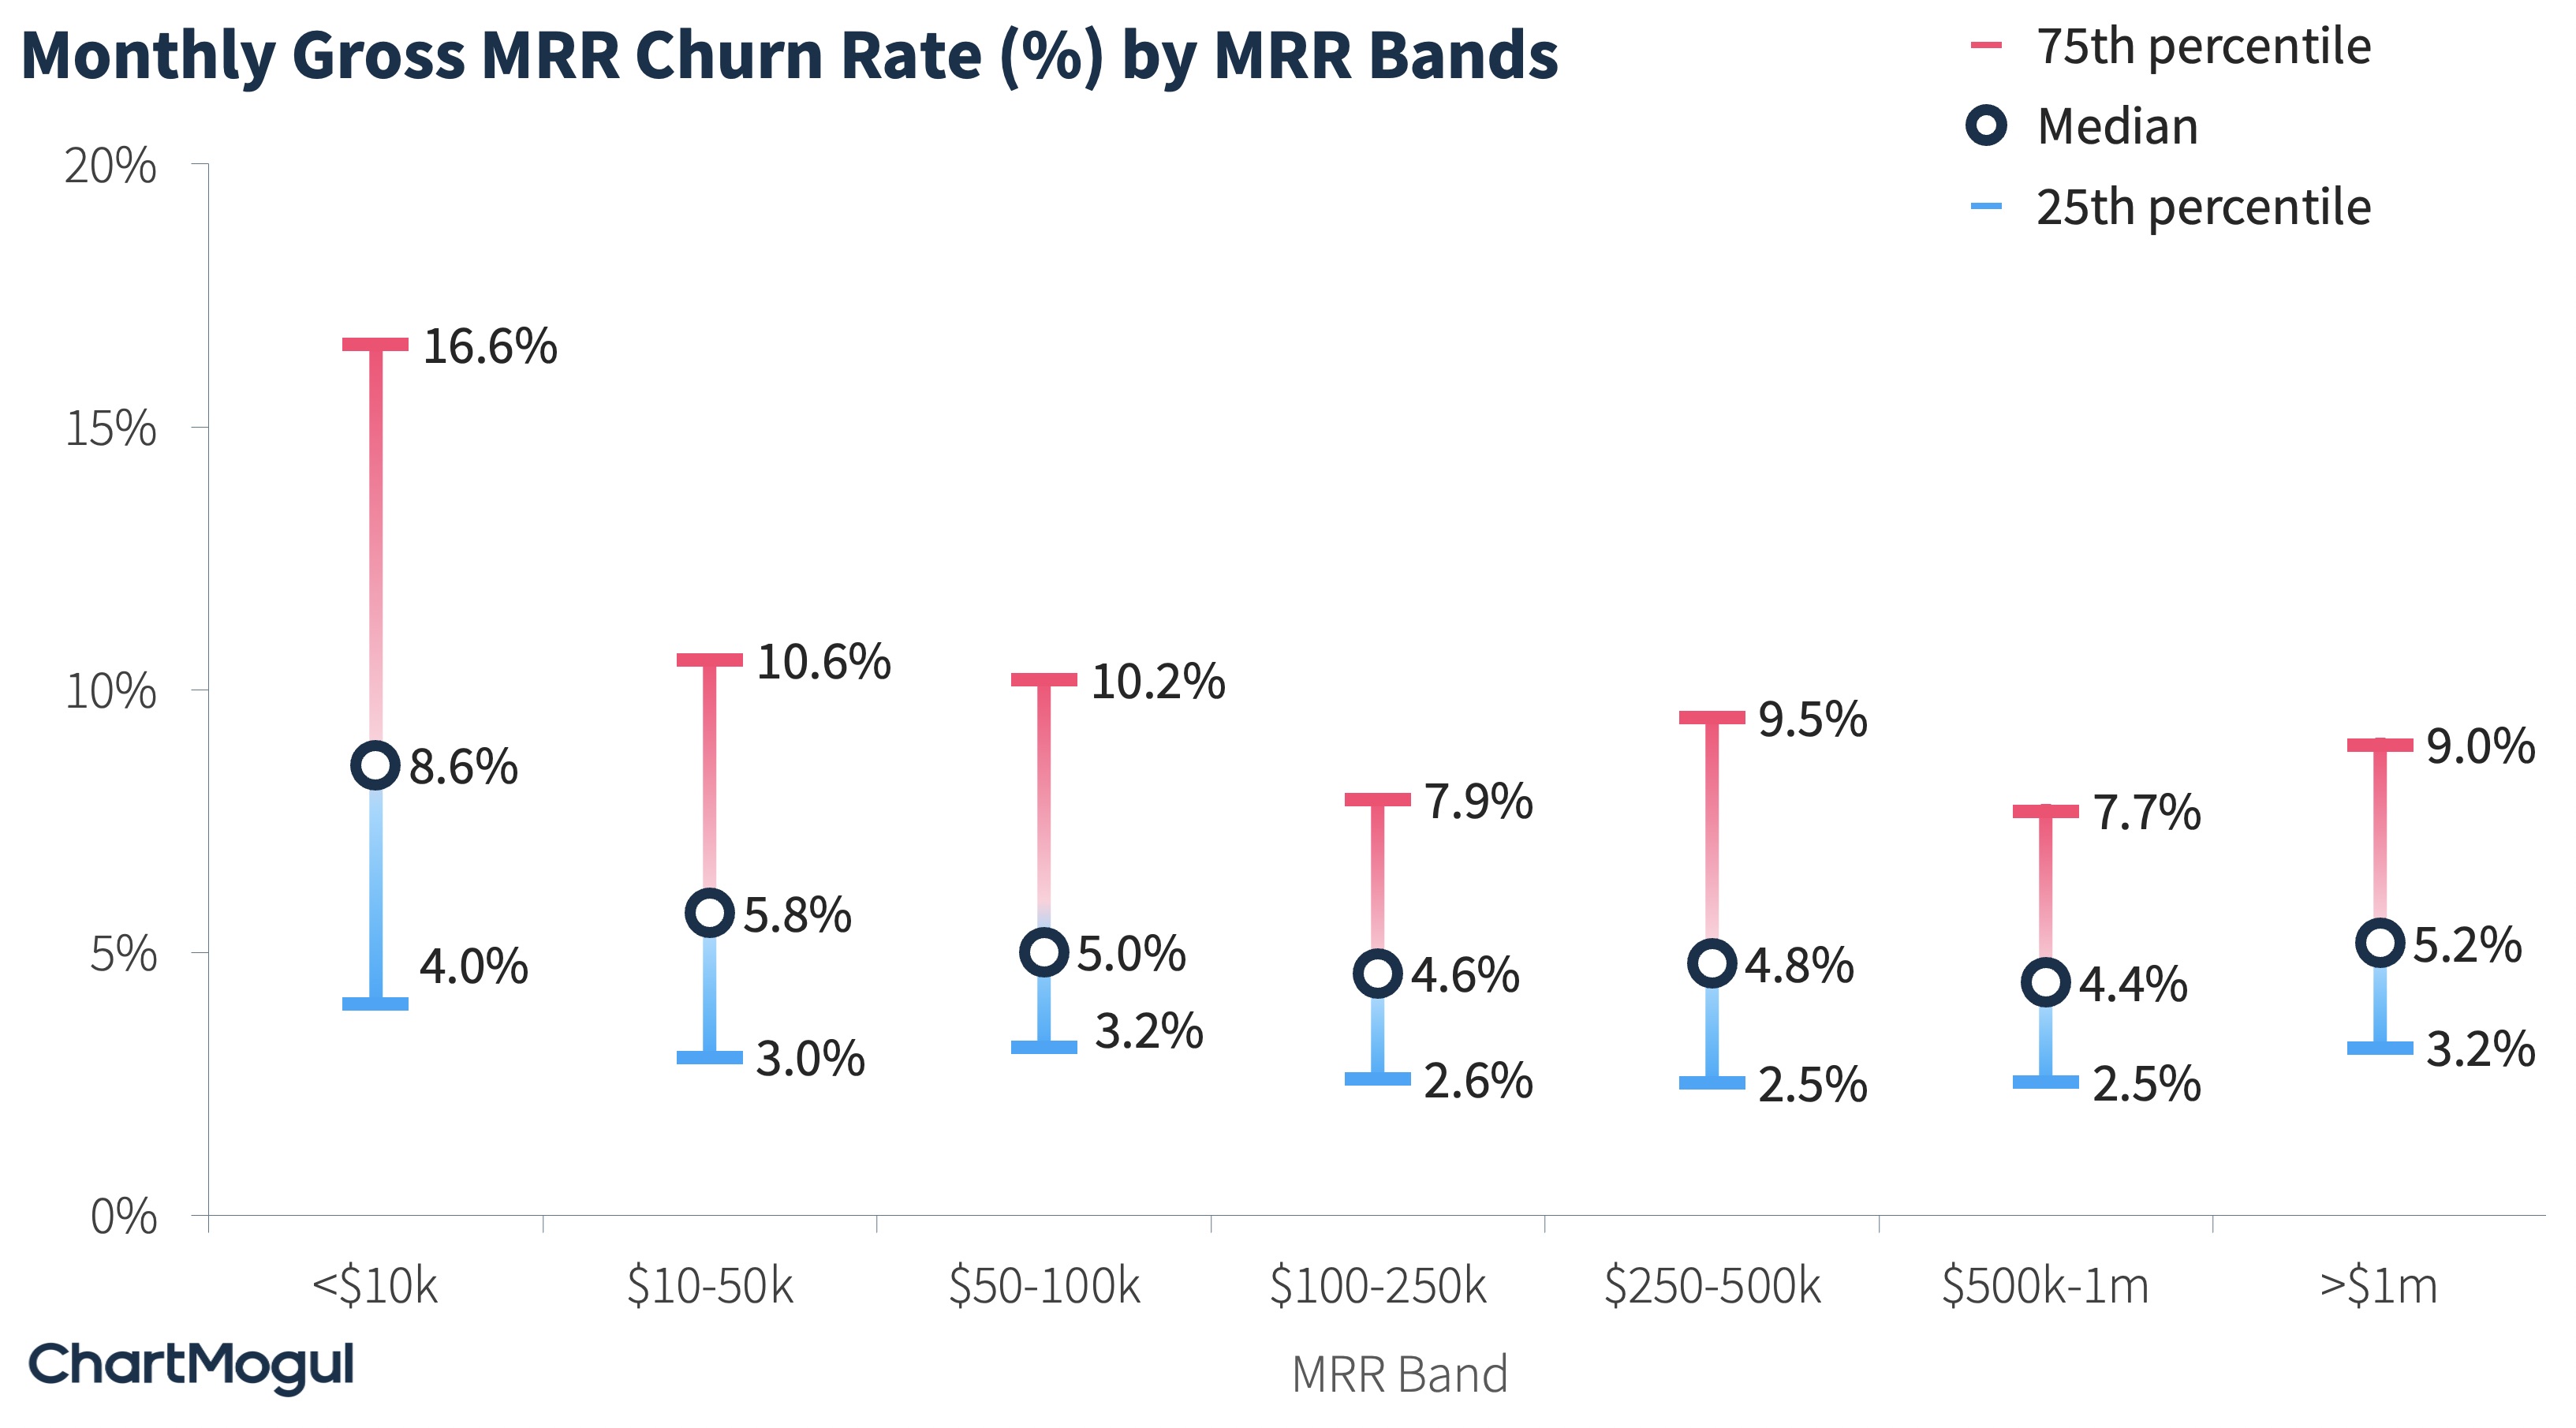
Image Credits: ChartMogul
Net MRR churn benchmarks
Now, let’s dive into benchmarks for net MRR churn rate. The chart below shows the net MRR churn rate split by ARPA per month bands.
As is the case with any churn rate versus ARPA graph, here, too, a higher ARPA correlates to a lower net MRR churn rate.
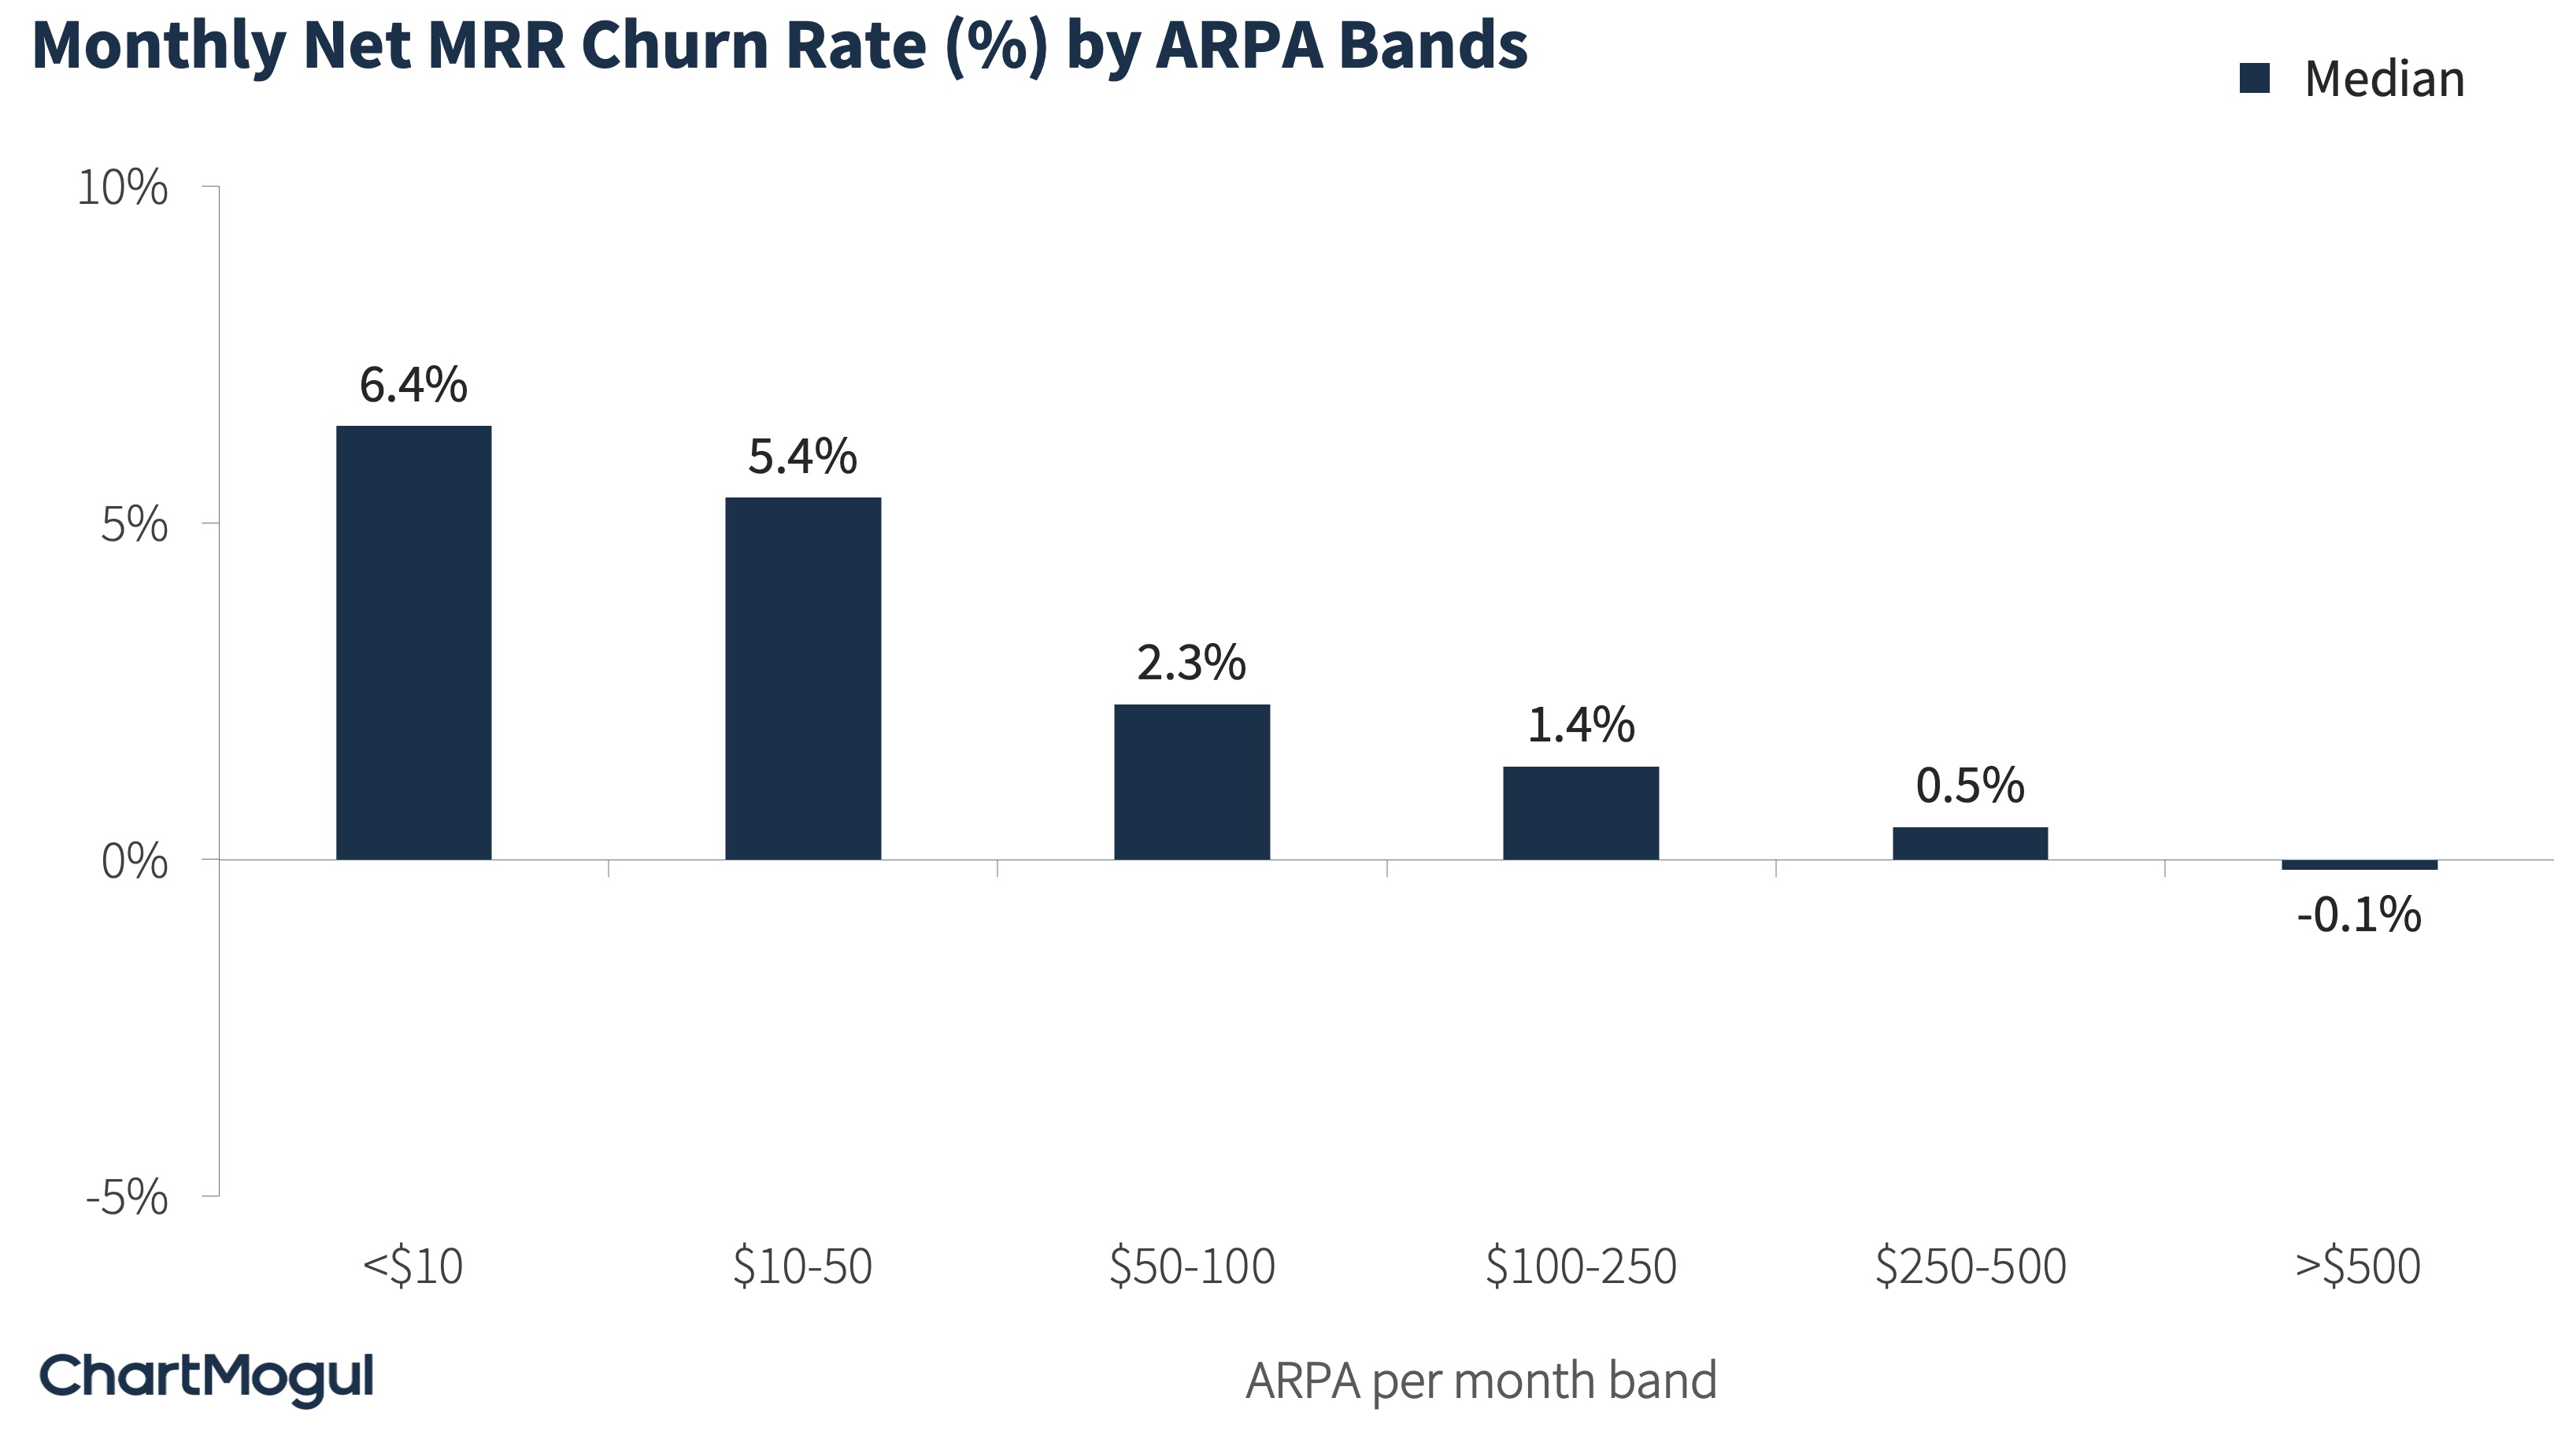
Image Credits: ChartMogul
At higher APRA ranges, expansion starts to drive a lot of revenue, which contributes to negative churn.
The impact is so prominent that at higher ARPAs, net negative churn is the norm and not the exception. See the chart below: 53.4% of companies with ARPA higher than $500 have net negative churn.
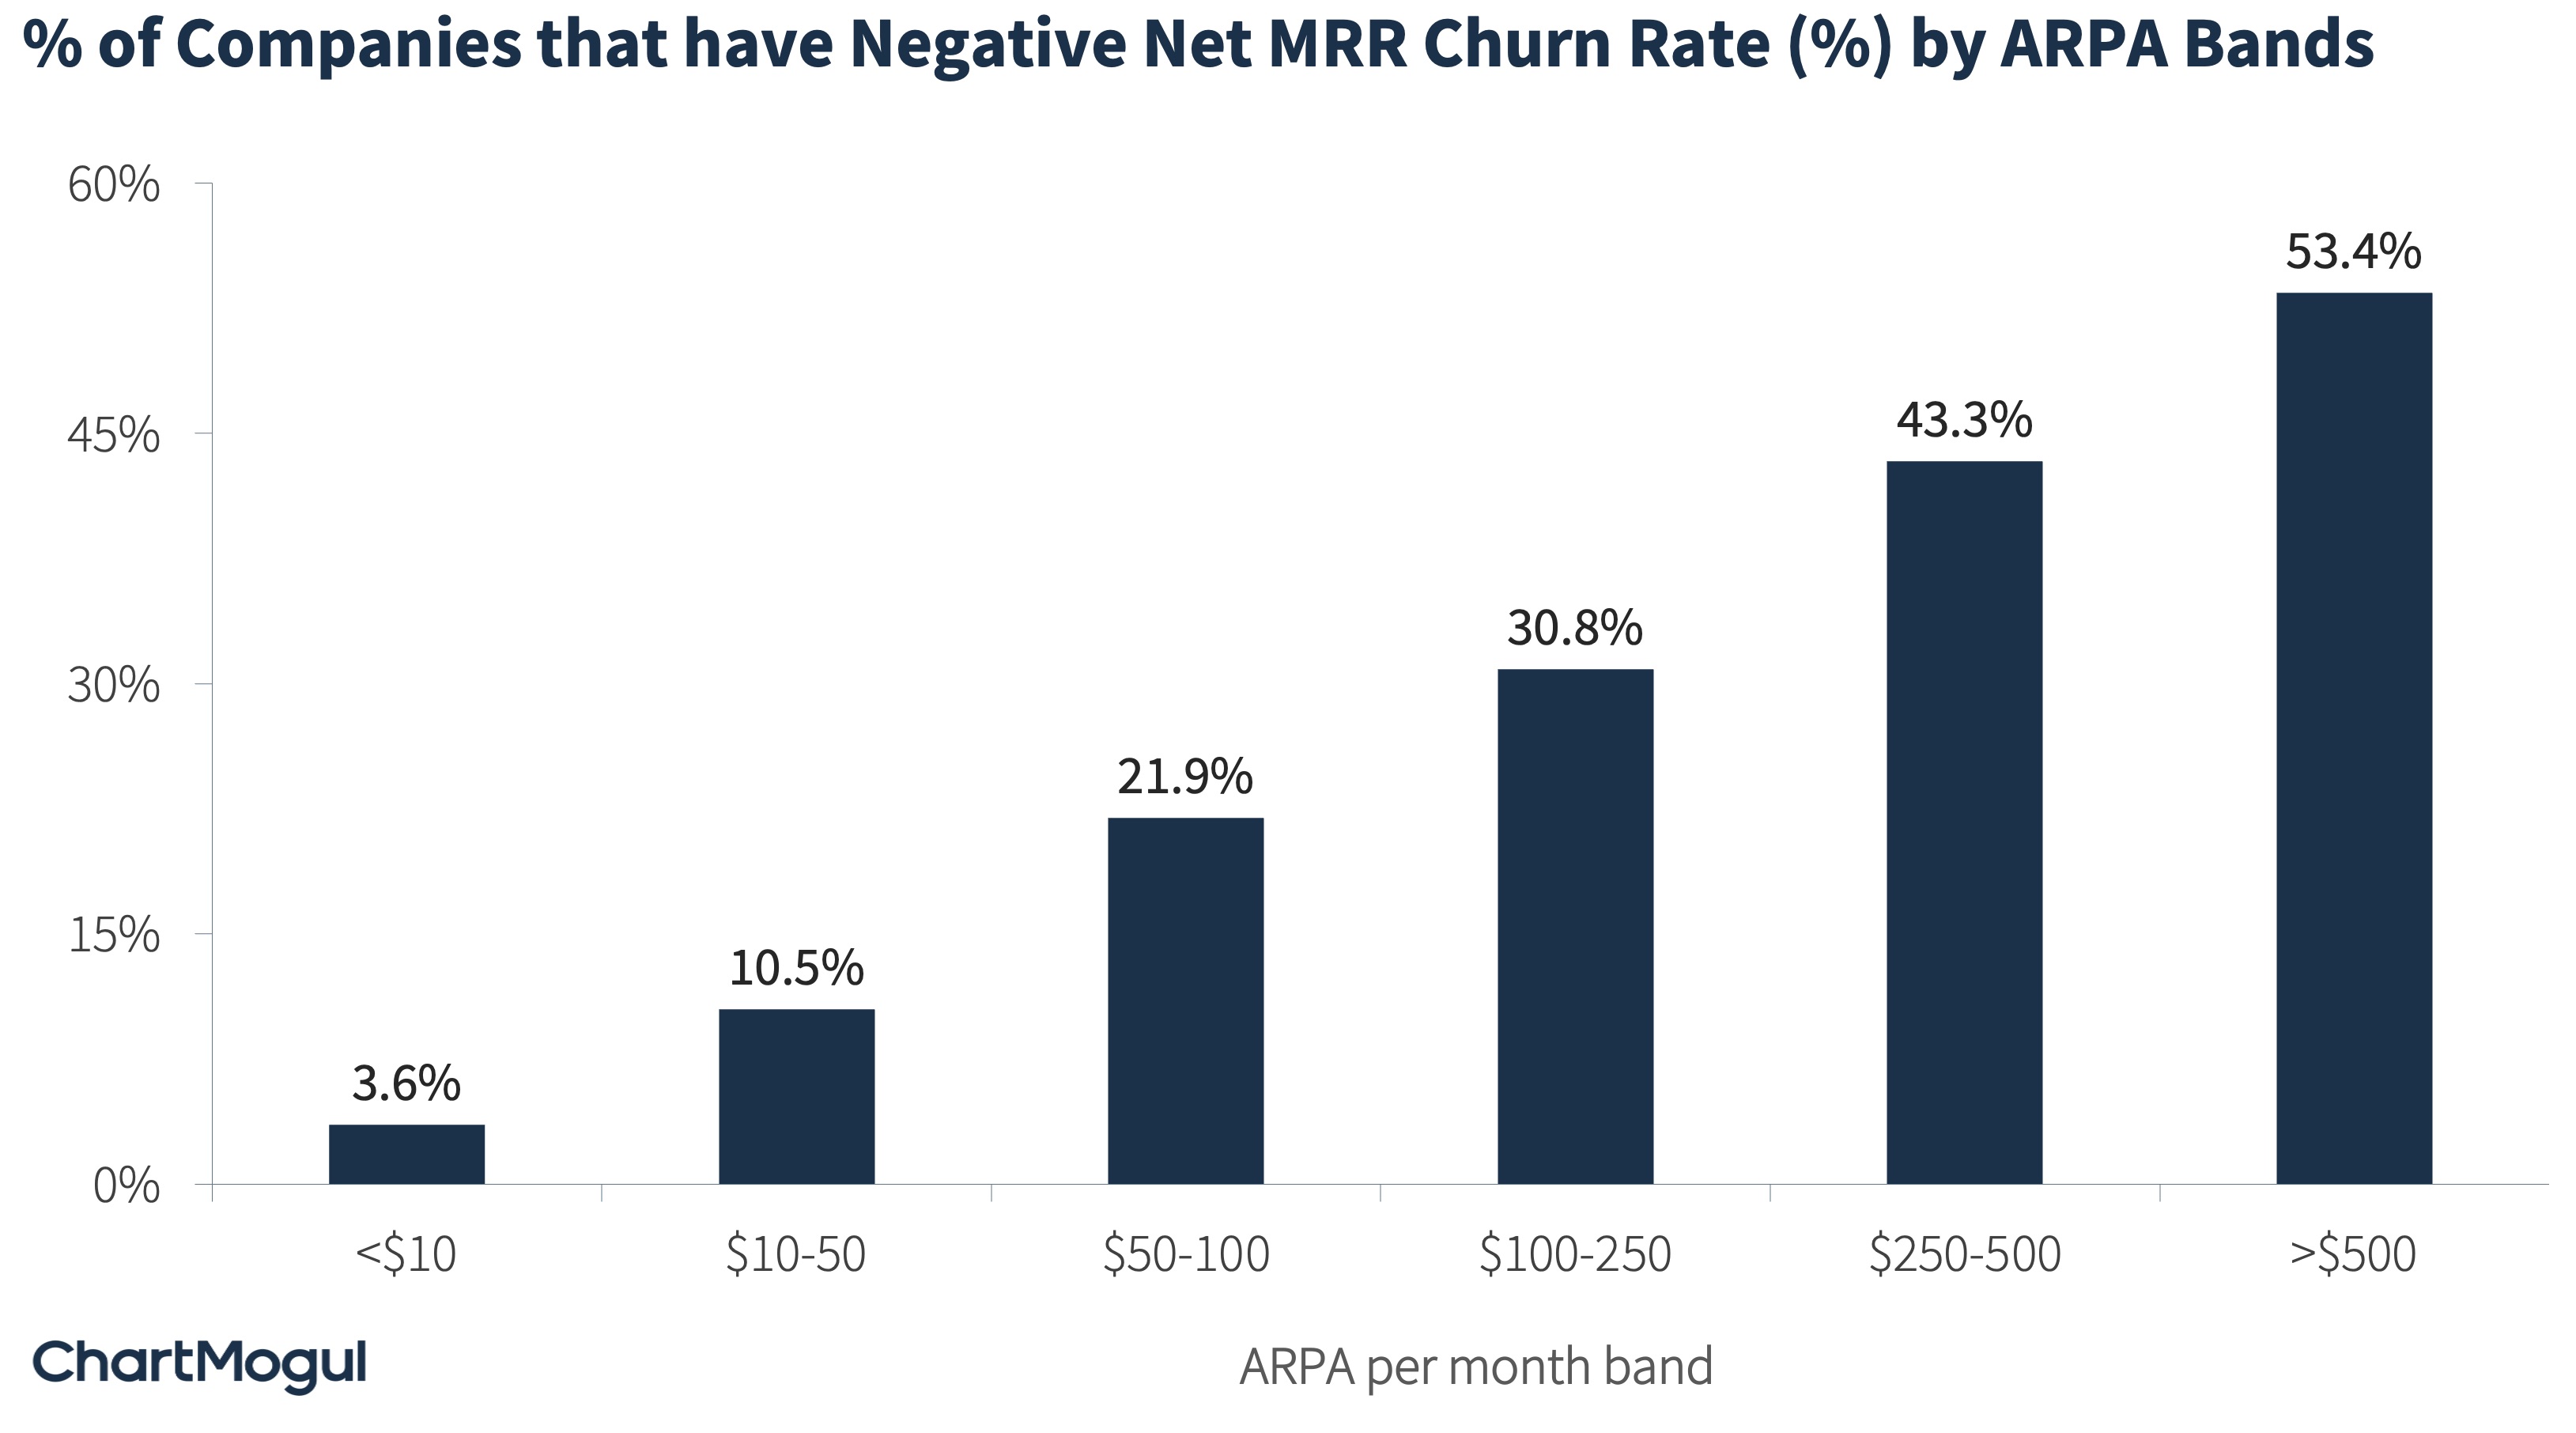
Image Credits: ChartMogul
Let’s now look at the 25th and 75th percentile of the monthly net MRR churn rate, in addition to the median.
Note that at the higher end of the range, some companies have a net MRR churn rate in excess of 11% per month. That’s too high, in our opinion. You just can’t create a sustainable SaaS business with that level of churn.
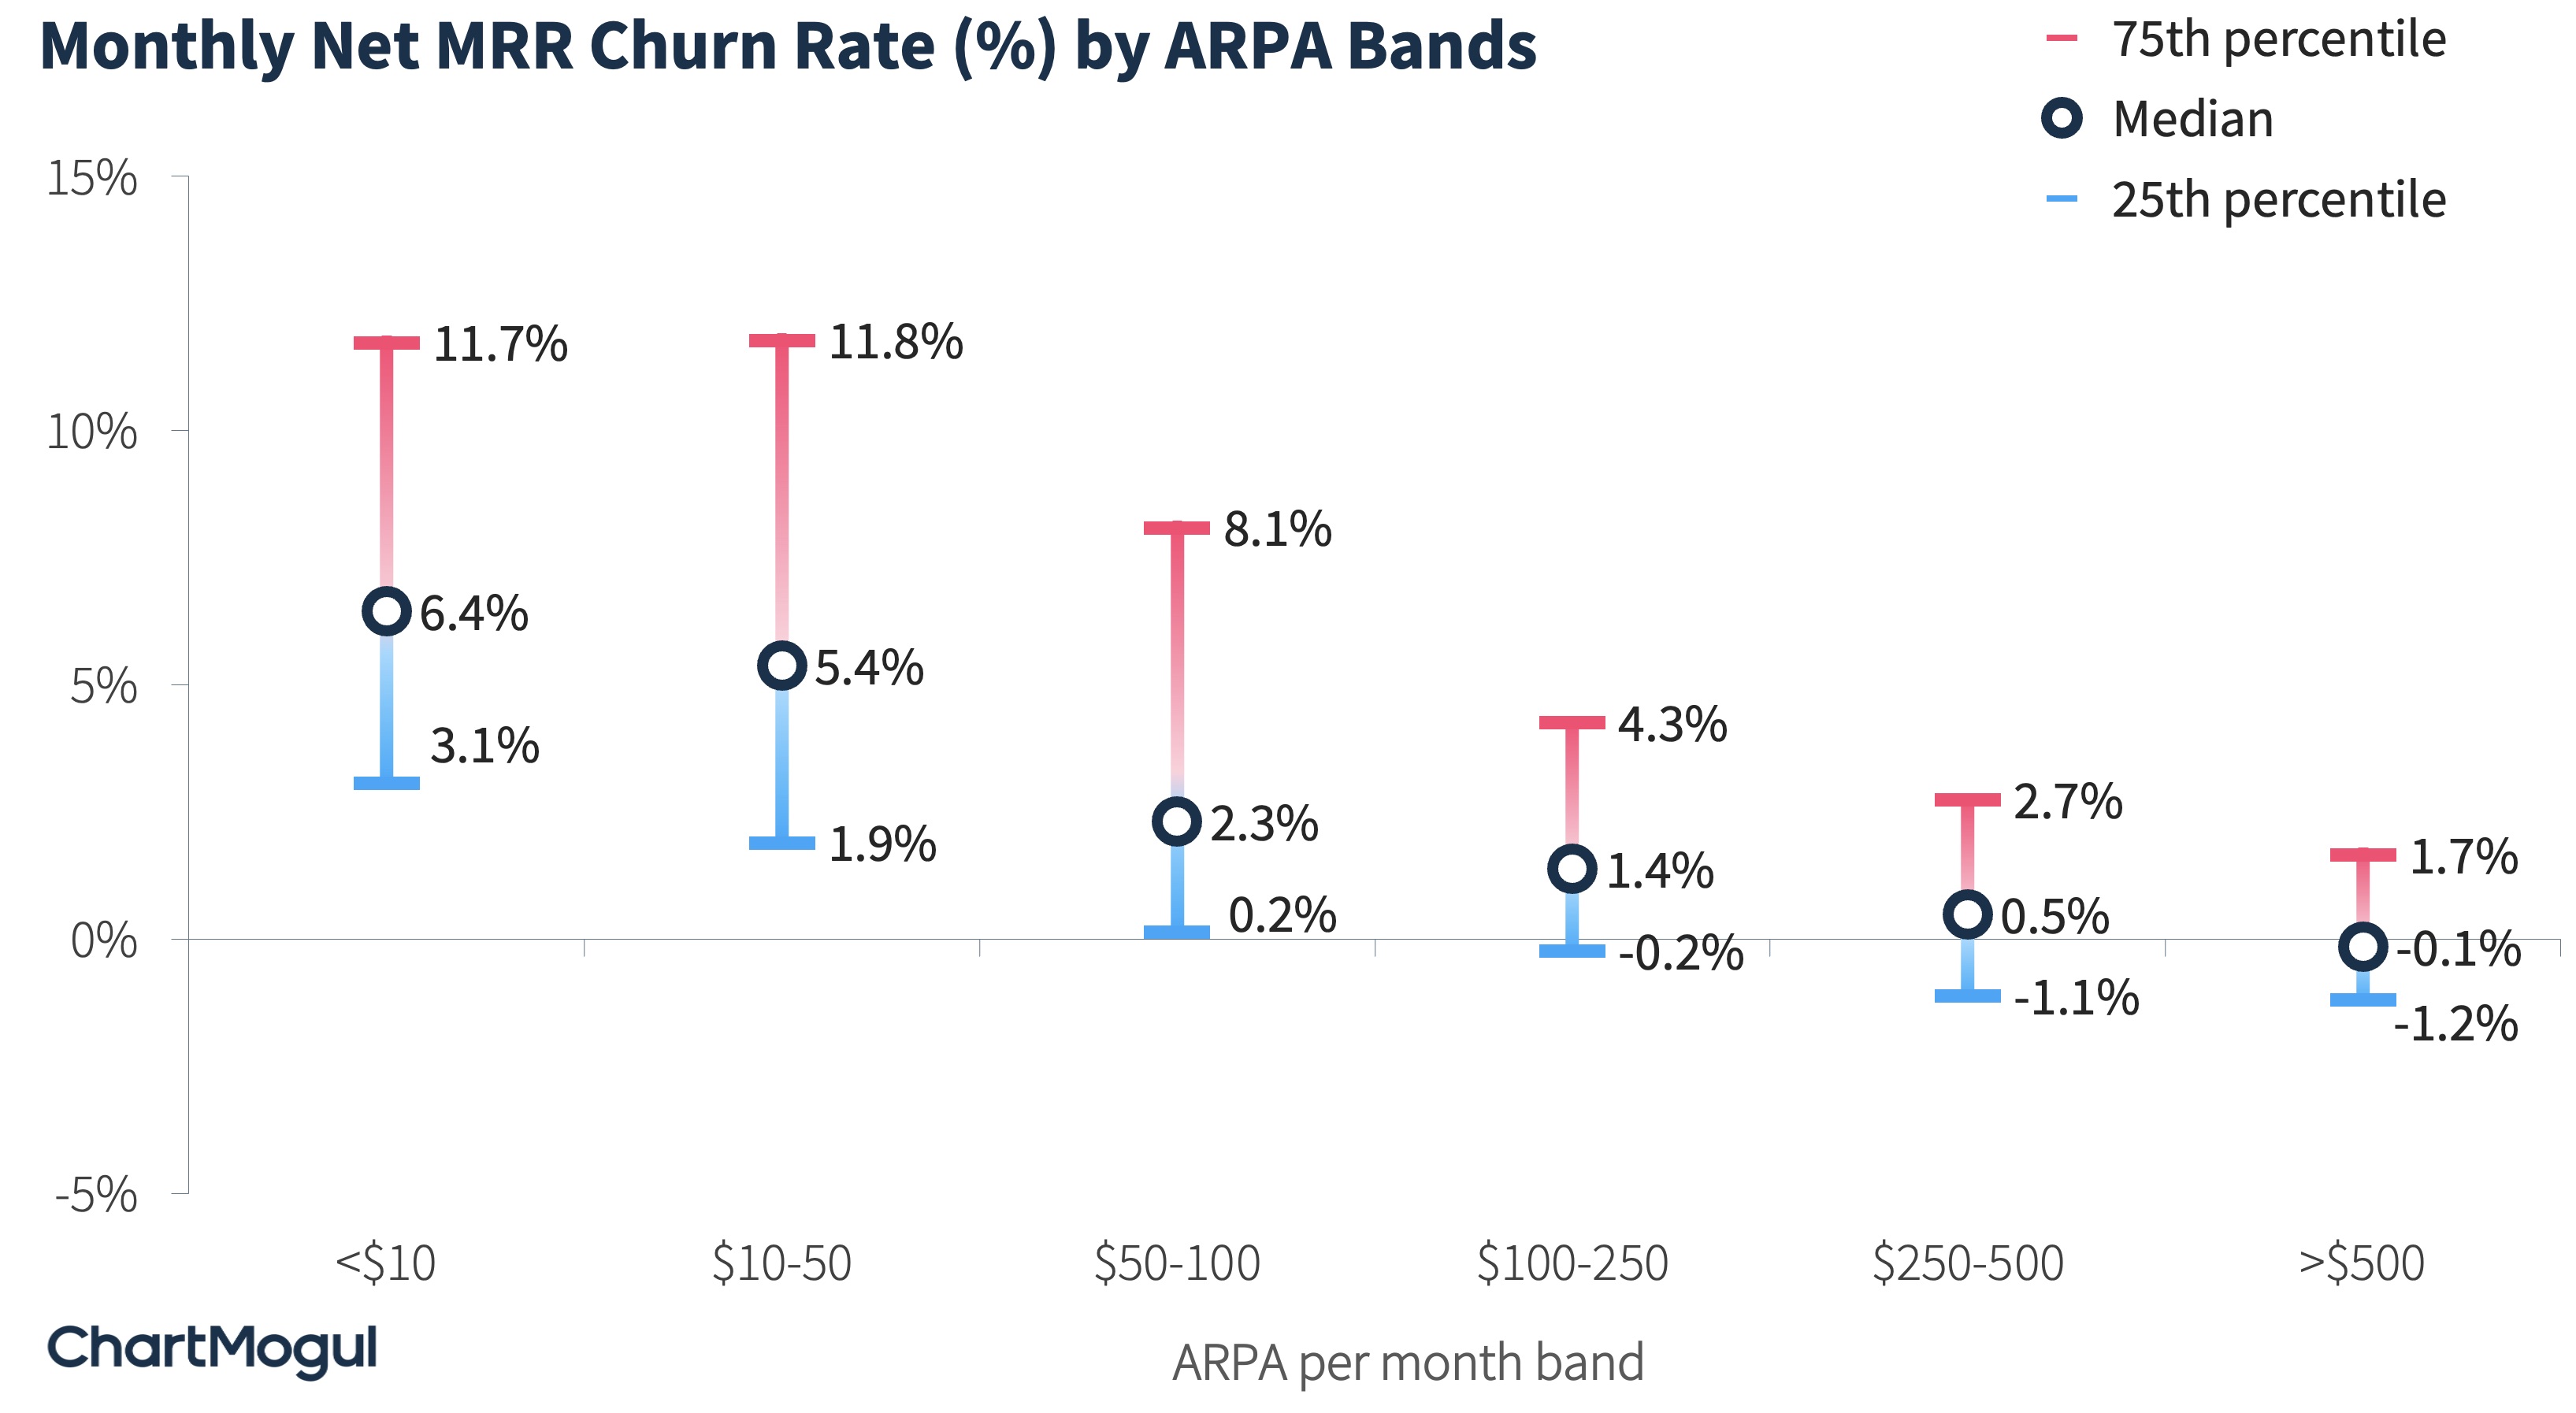
Image Credits: ChartMogul
A monthly net MRR churn rate of 11% corresponds to losing almost three-quarters (75%) of your existing revenue over the next 12 months. It’s not at all sustainable.
Here is a helpful table that helps you look at the monthly churn and the corresponding yearly churn number.
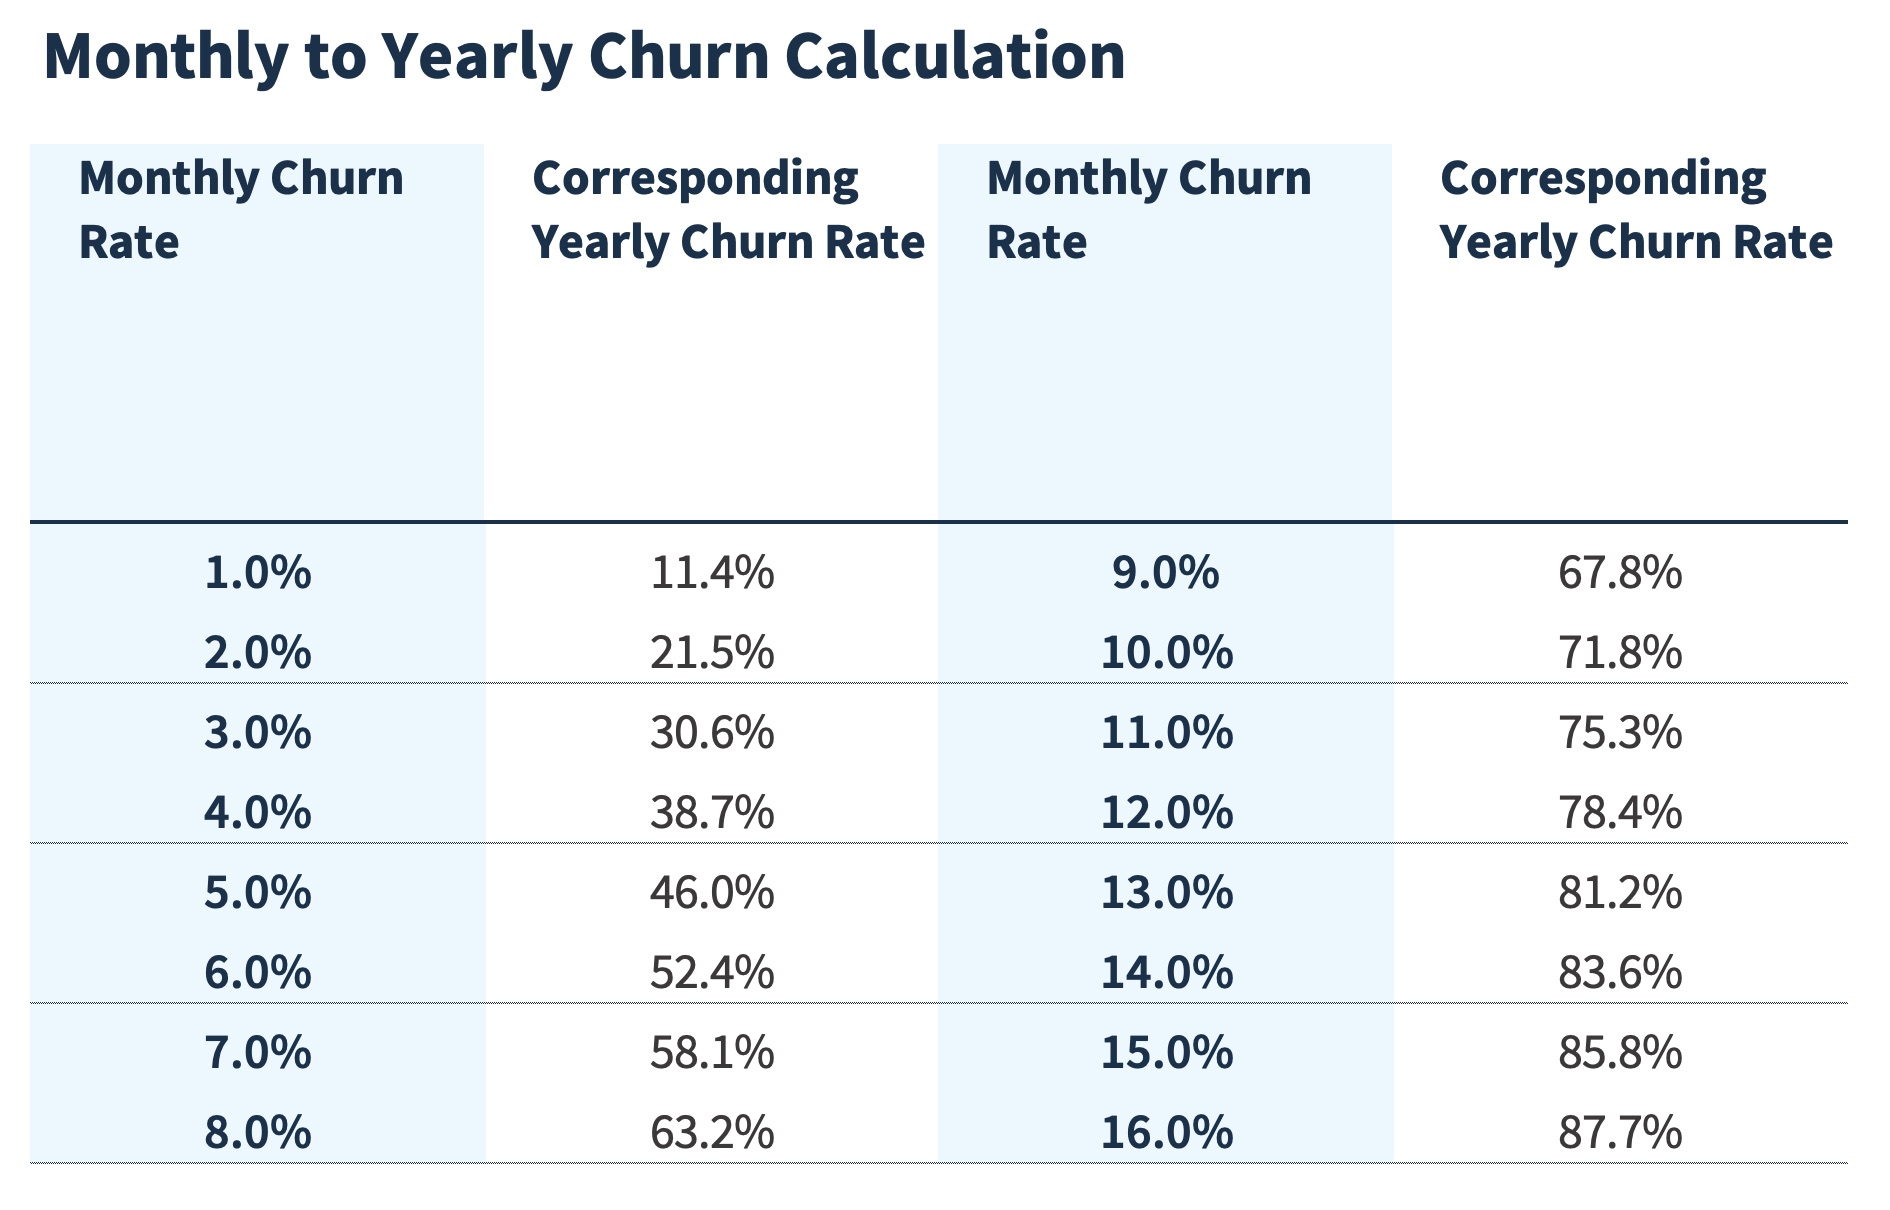
Image Credits: ChartMogul
The formula we use to get the annual churn rate from the monthly churn rate is: annual churn rate = (1– (1 – monthly churn rate)12).
If your business has a high churn rate, you won’t be able to compound your revenue, and the time and money you spent to acquire your customers (customer acquisition cost) will go to waste sooner.
Let’s move on and look at net MRR churn benchmarks by MRR bands. The chart below shows the median monthly net MRR churn rate by MRR bands.
As you’ll notice, the monthly net MRR churn rate is higher in the initial stages of the company, but decreases as the company grows. It stabilizes in the 1%-2% range.
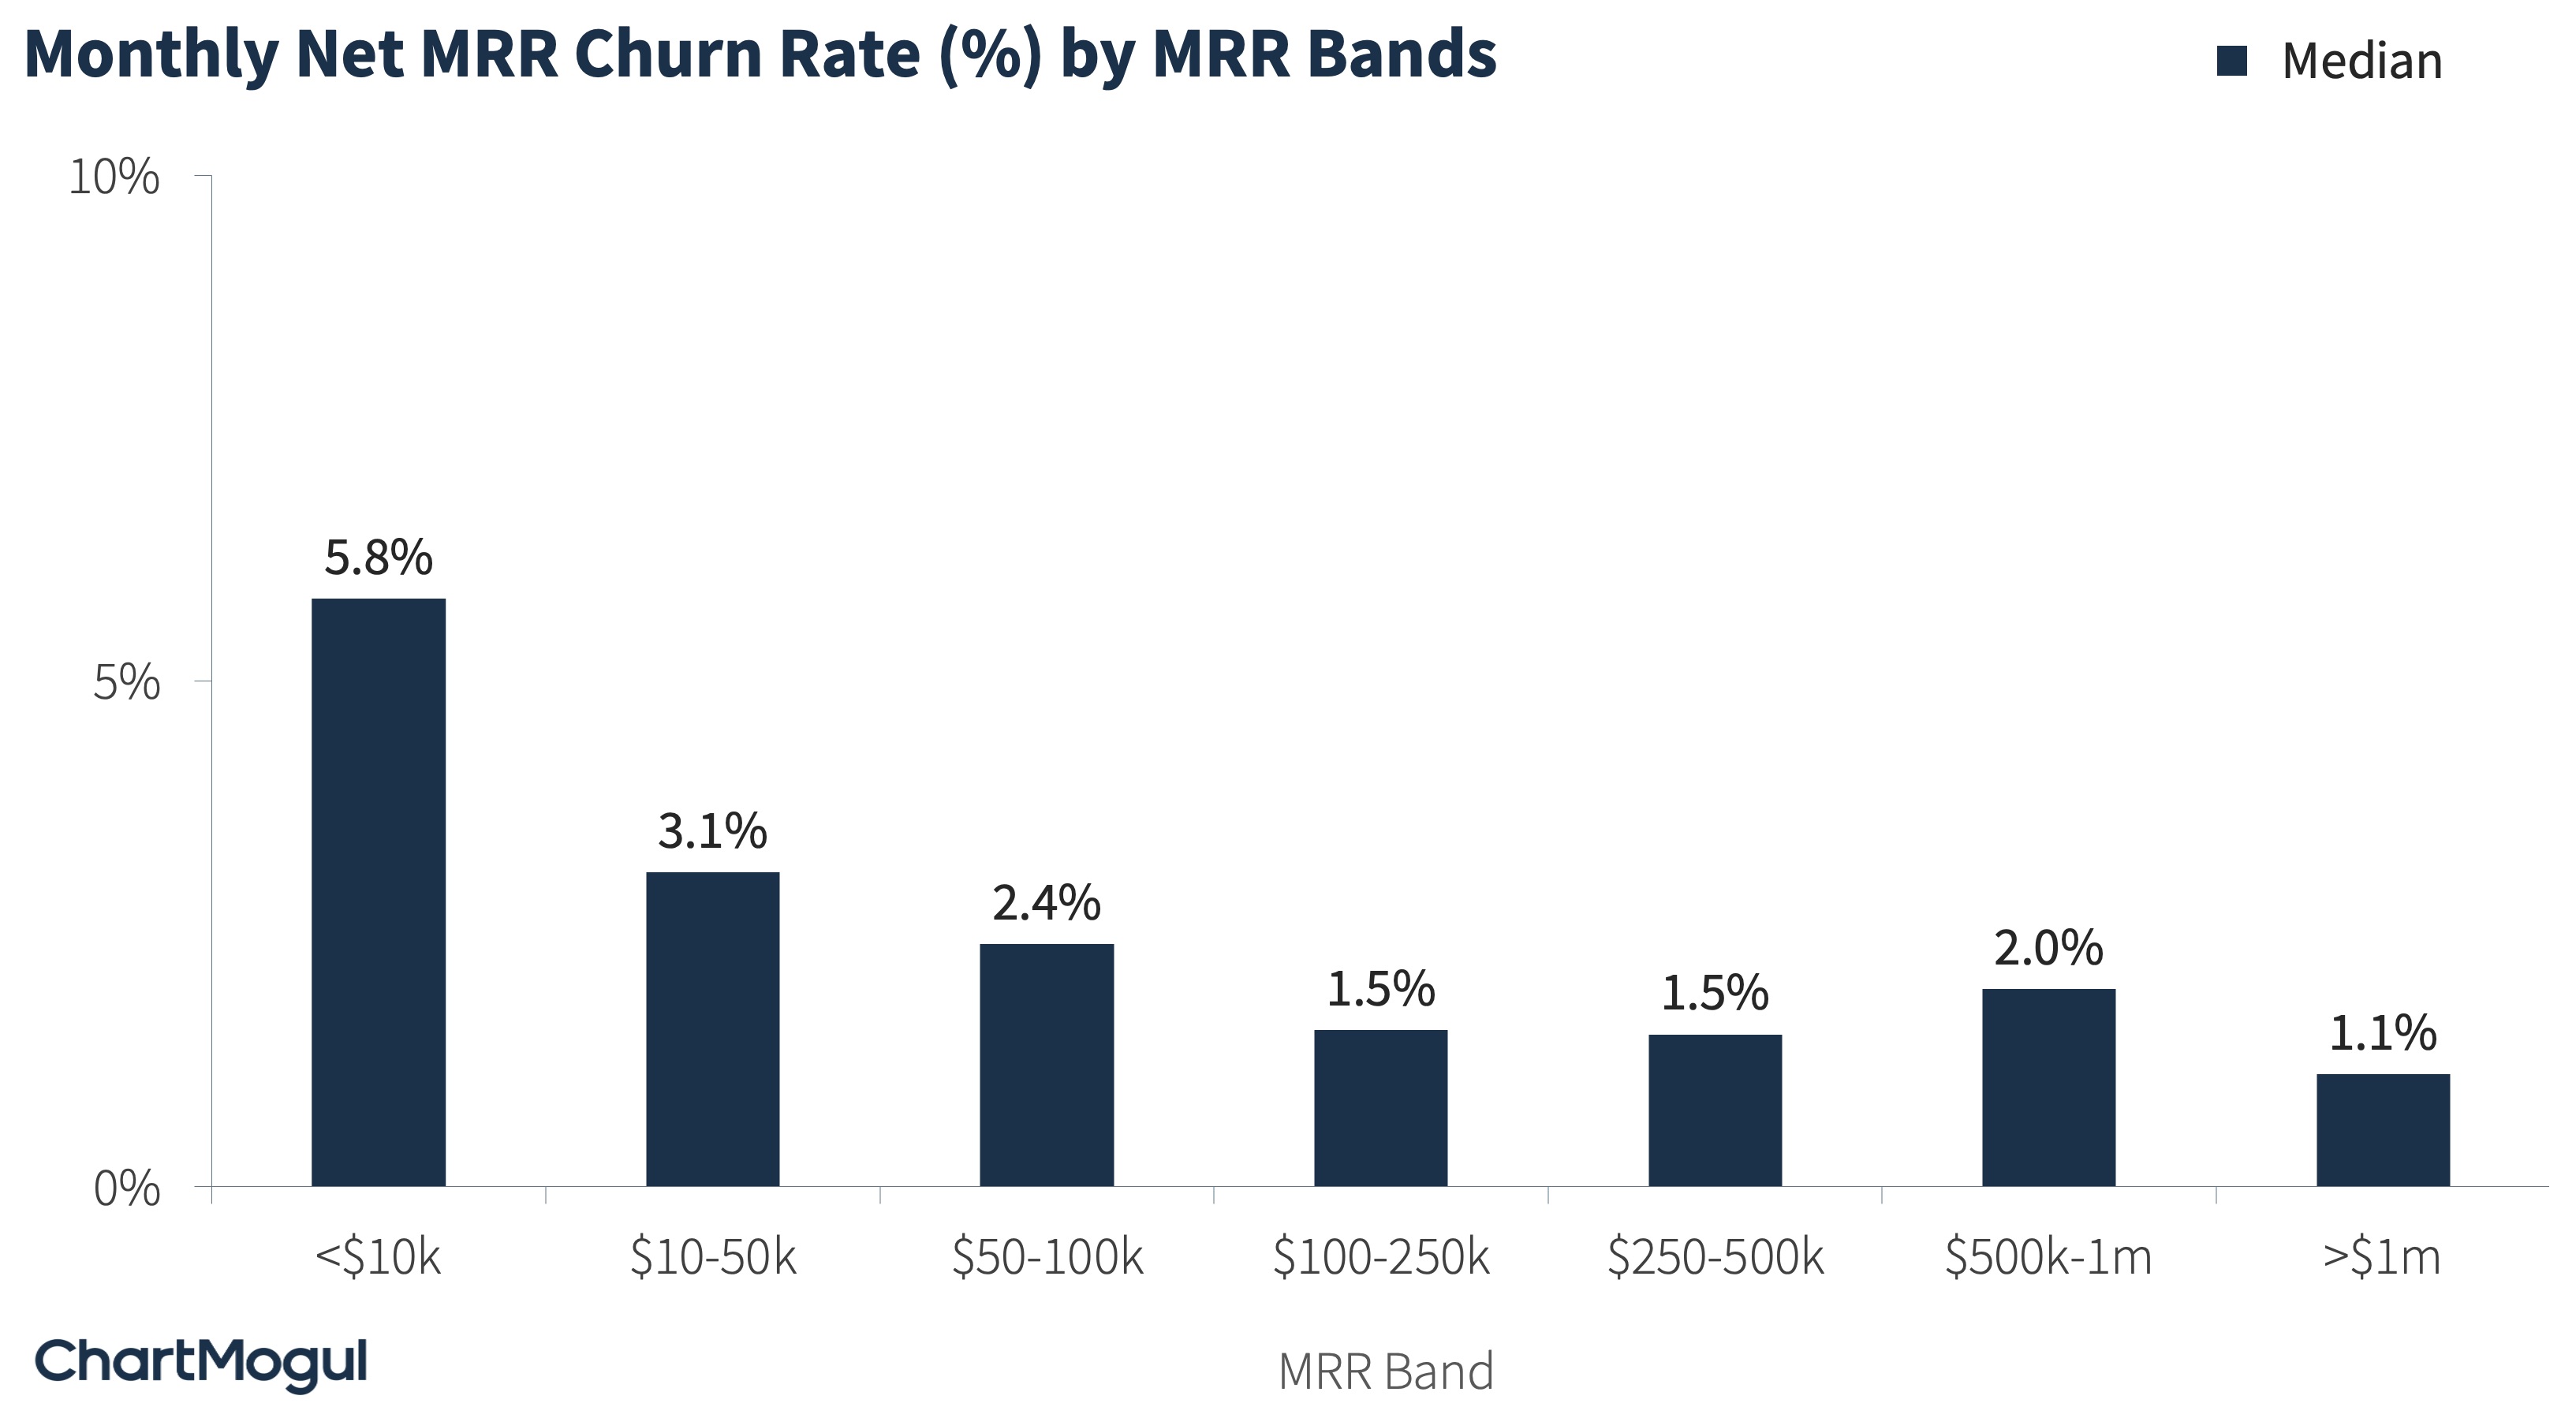
Image Credits: ChartMogul
In addition to the median, the below chart also shows the 25th and 75th percentile of the net MRR churn rate.
The best SaaS companies should target a net negative churn ( i.e., net MRR churn rate of less than 0%).
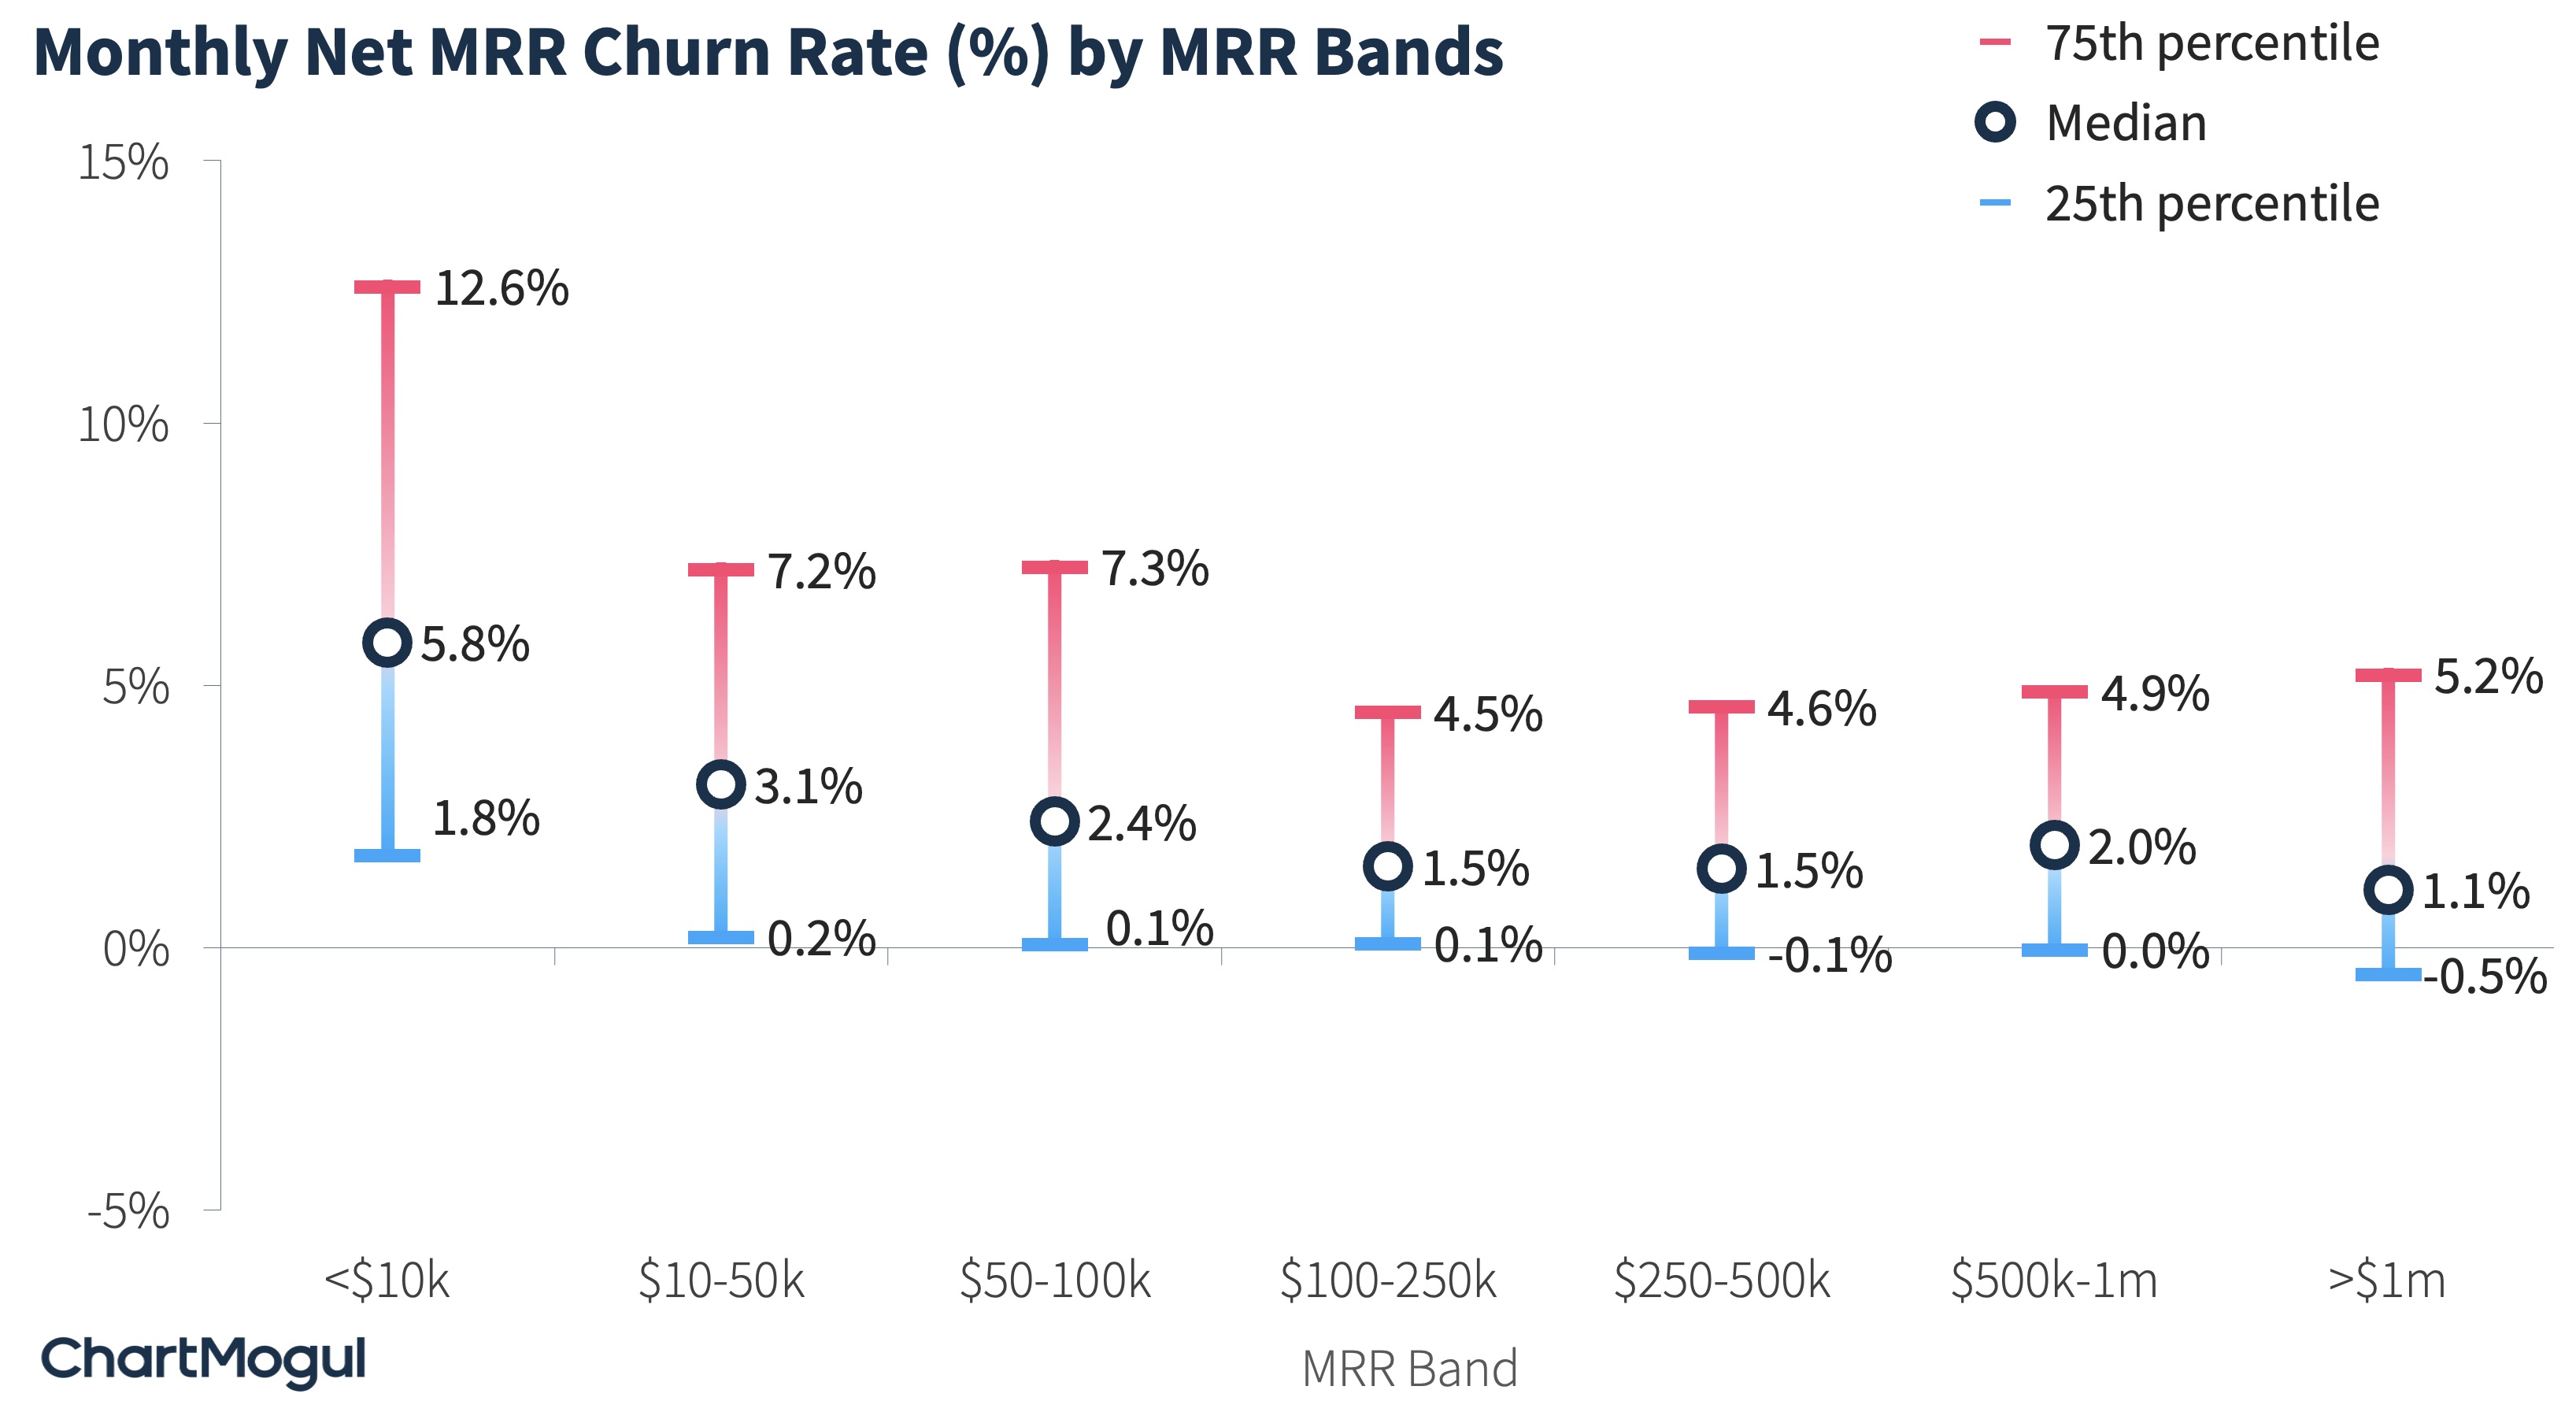
Image Credits: ChartMogul
How can your business achieve negative churn? By building an expansion loop within it. This is the only sustainable way to get to negative churn. No matter what you do, customers are always going to churn. Your job is to increase your revenue from those who stay.
Achieving a net negative churn isn’t a distant dream. It’s very much achievable. In fact, close to a quarter of companies at any MRR range have net negative churn. So aim high and go for it.
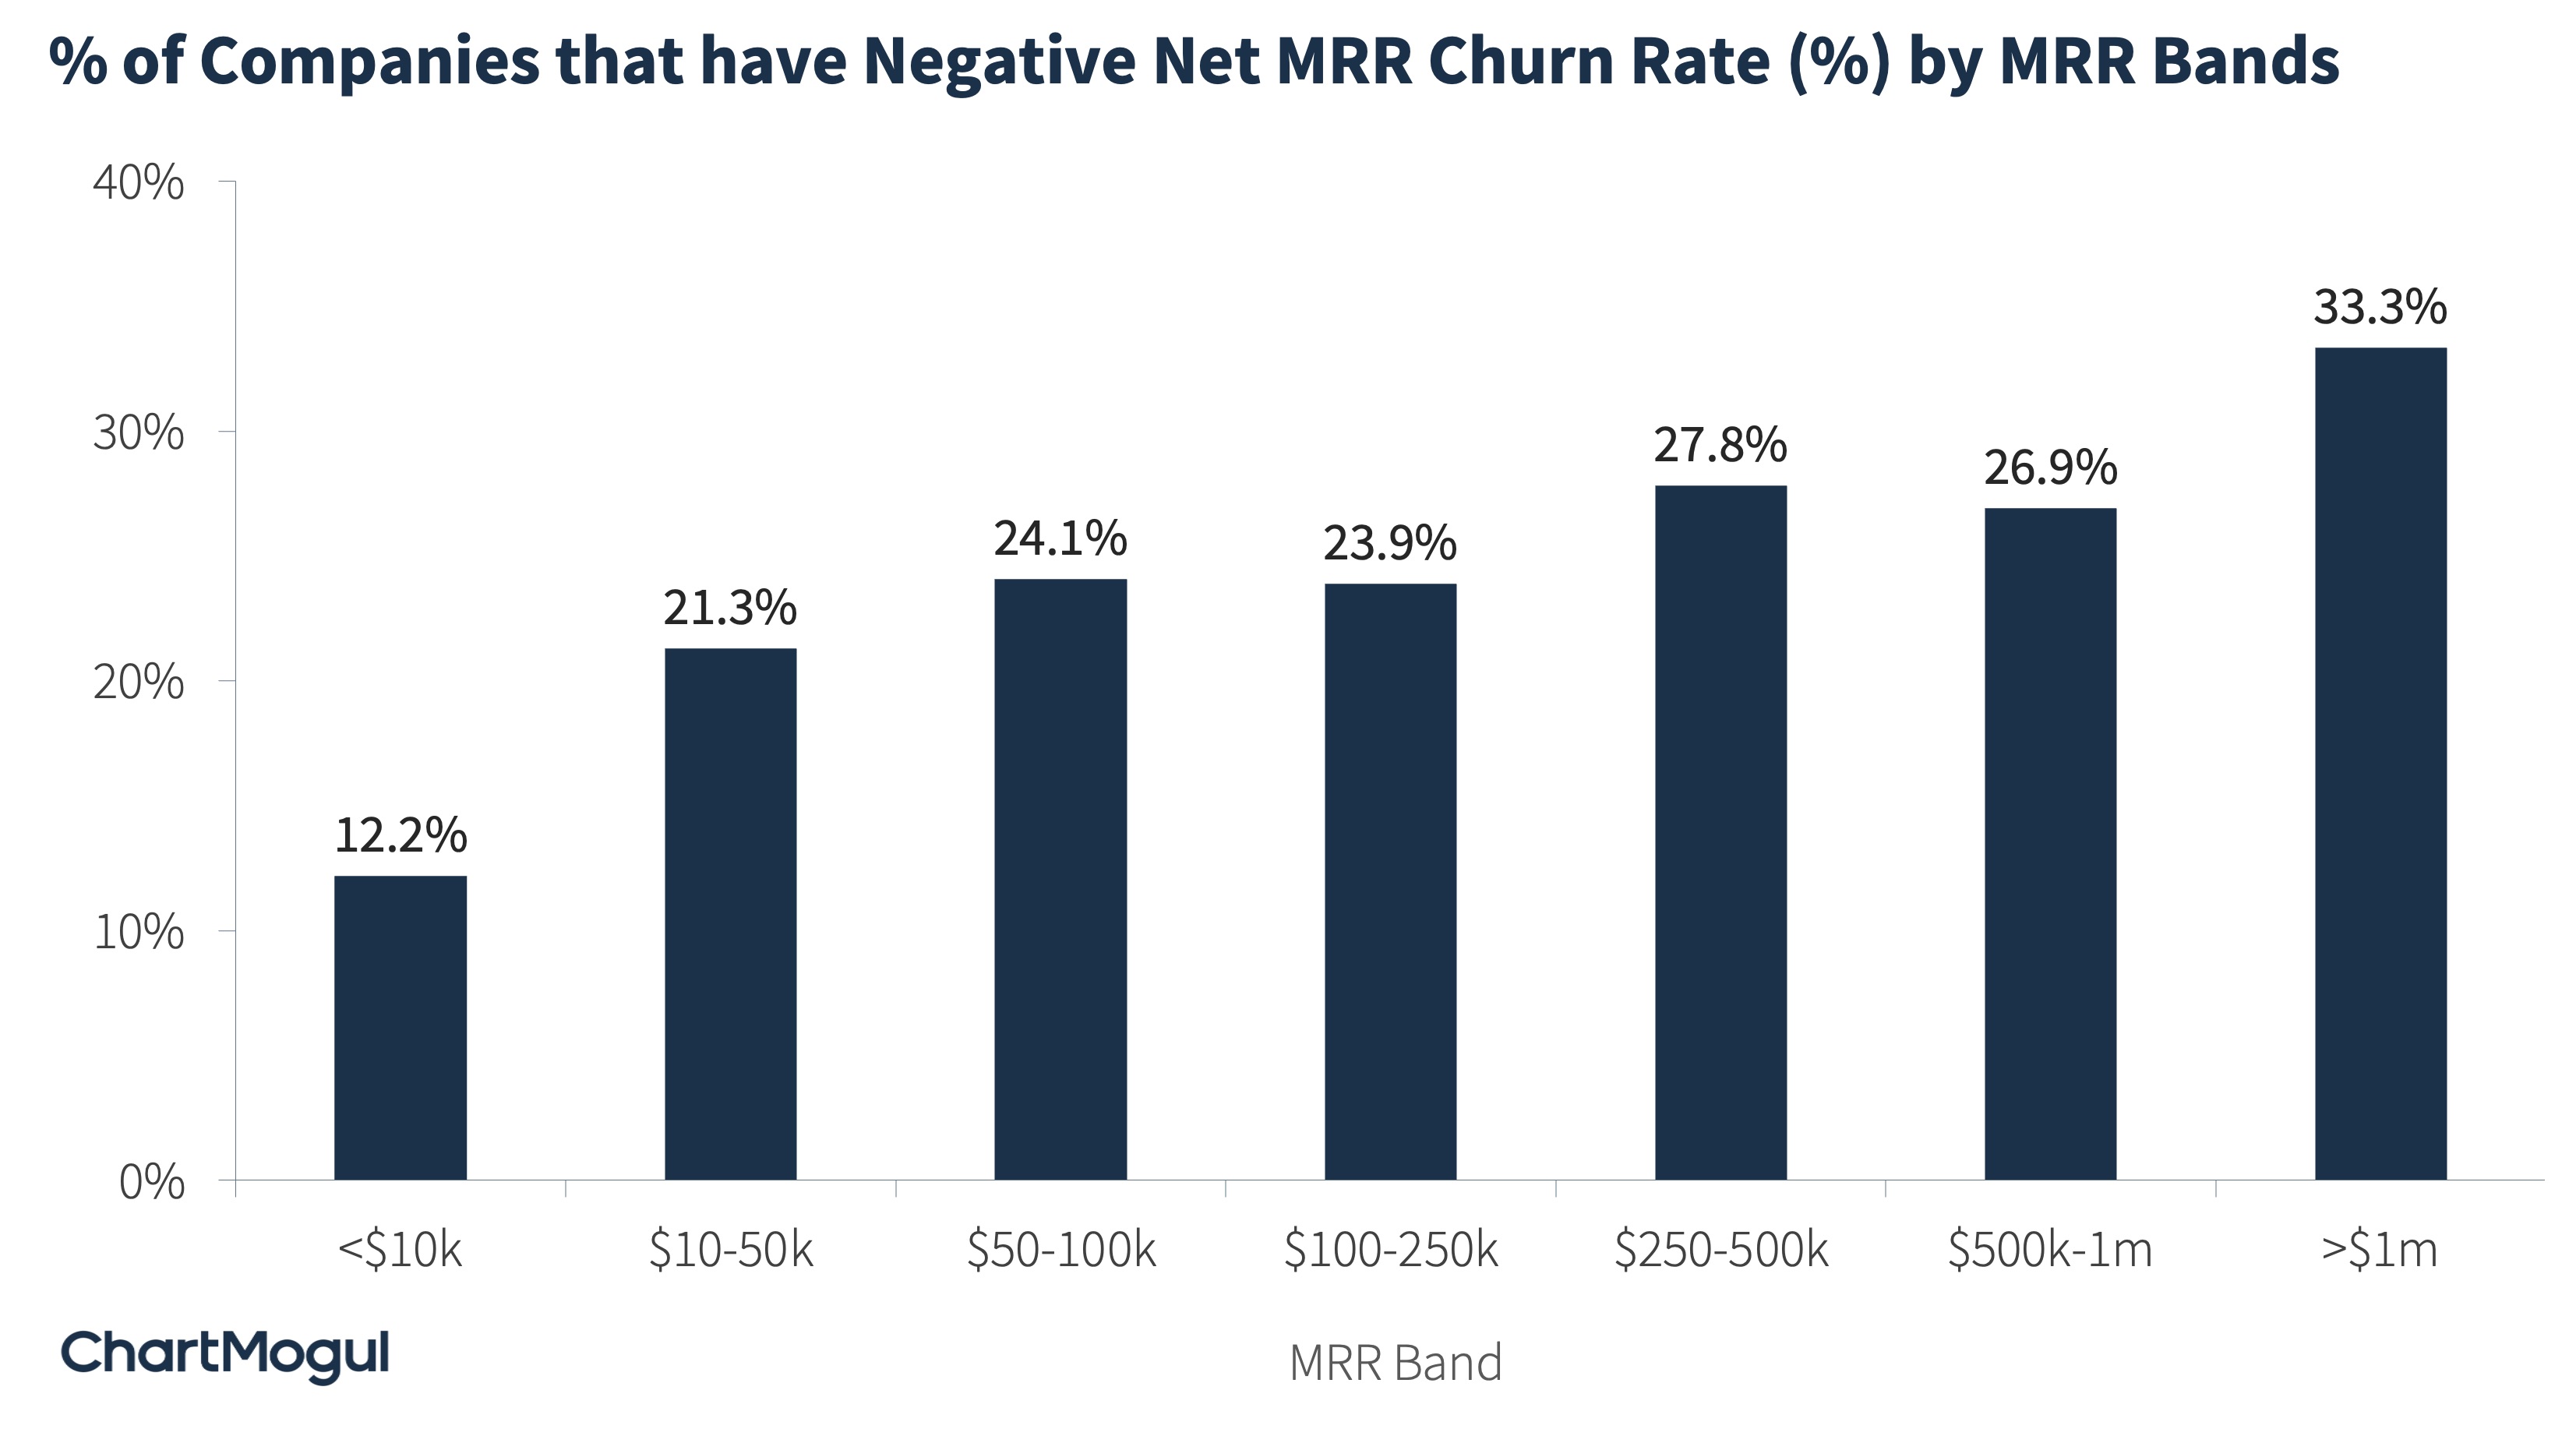
Image Credits: ChartMogul
Calculation Methodology: We used anonymized and aggregated data to calculate these aggregates. We calculated the aggregates over a three-month period (January, February and March 2022). We used standard B2B churn formulas for all companies for easier comparability.