
In 2020, New Relic launched its New Relic One platform, its attempt to bring together the many point solutions the company had built over the course of the years under a single umbrella with a modern infrastructure stack and a refreshed user experience. Last year, New Relic built on top of this — and its NRDB data storage system — with improved network monitoring, an ML model performance monitoring and error tracking tool and more (in addition to its acquisition of CodeStream, which brought the New Relic user experience to the IDE). Today, the company is putting one of the last pieces of this project in place with the general availability of its new infrastructure monitoring experience.
Designed to help DevOps, SRE and ITOps teams monitor their infrastructure and quickly resolve issues across public, private and hybrid cloud environments, this new solution is now available to New Relic users.
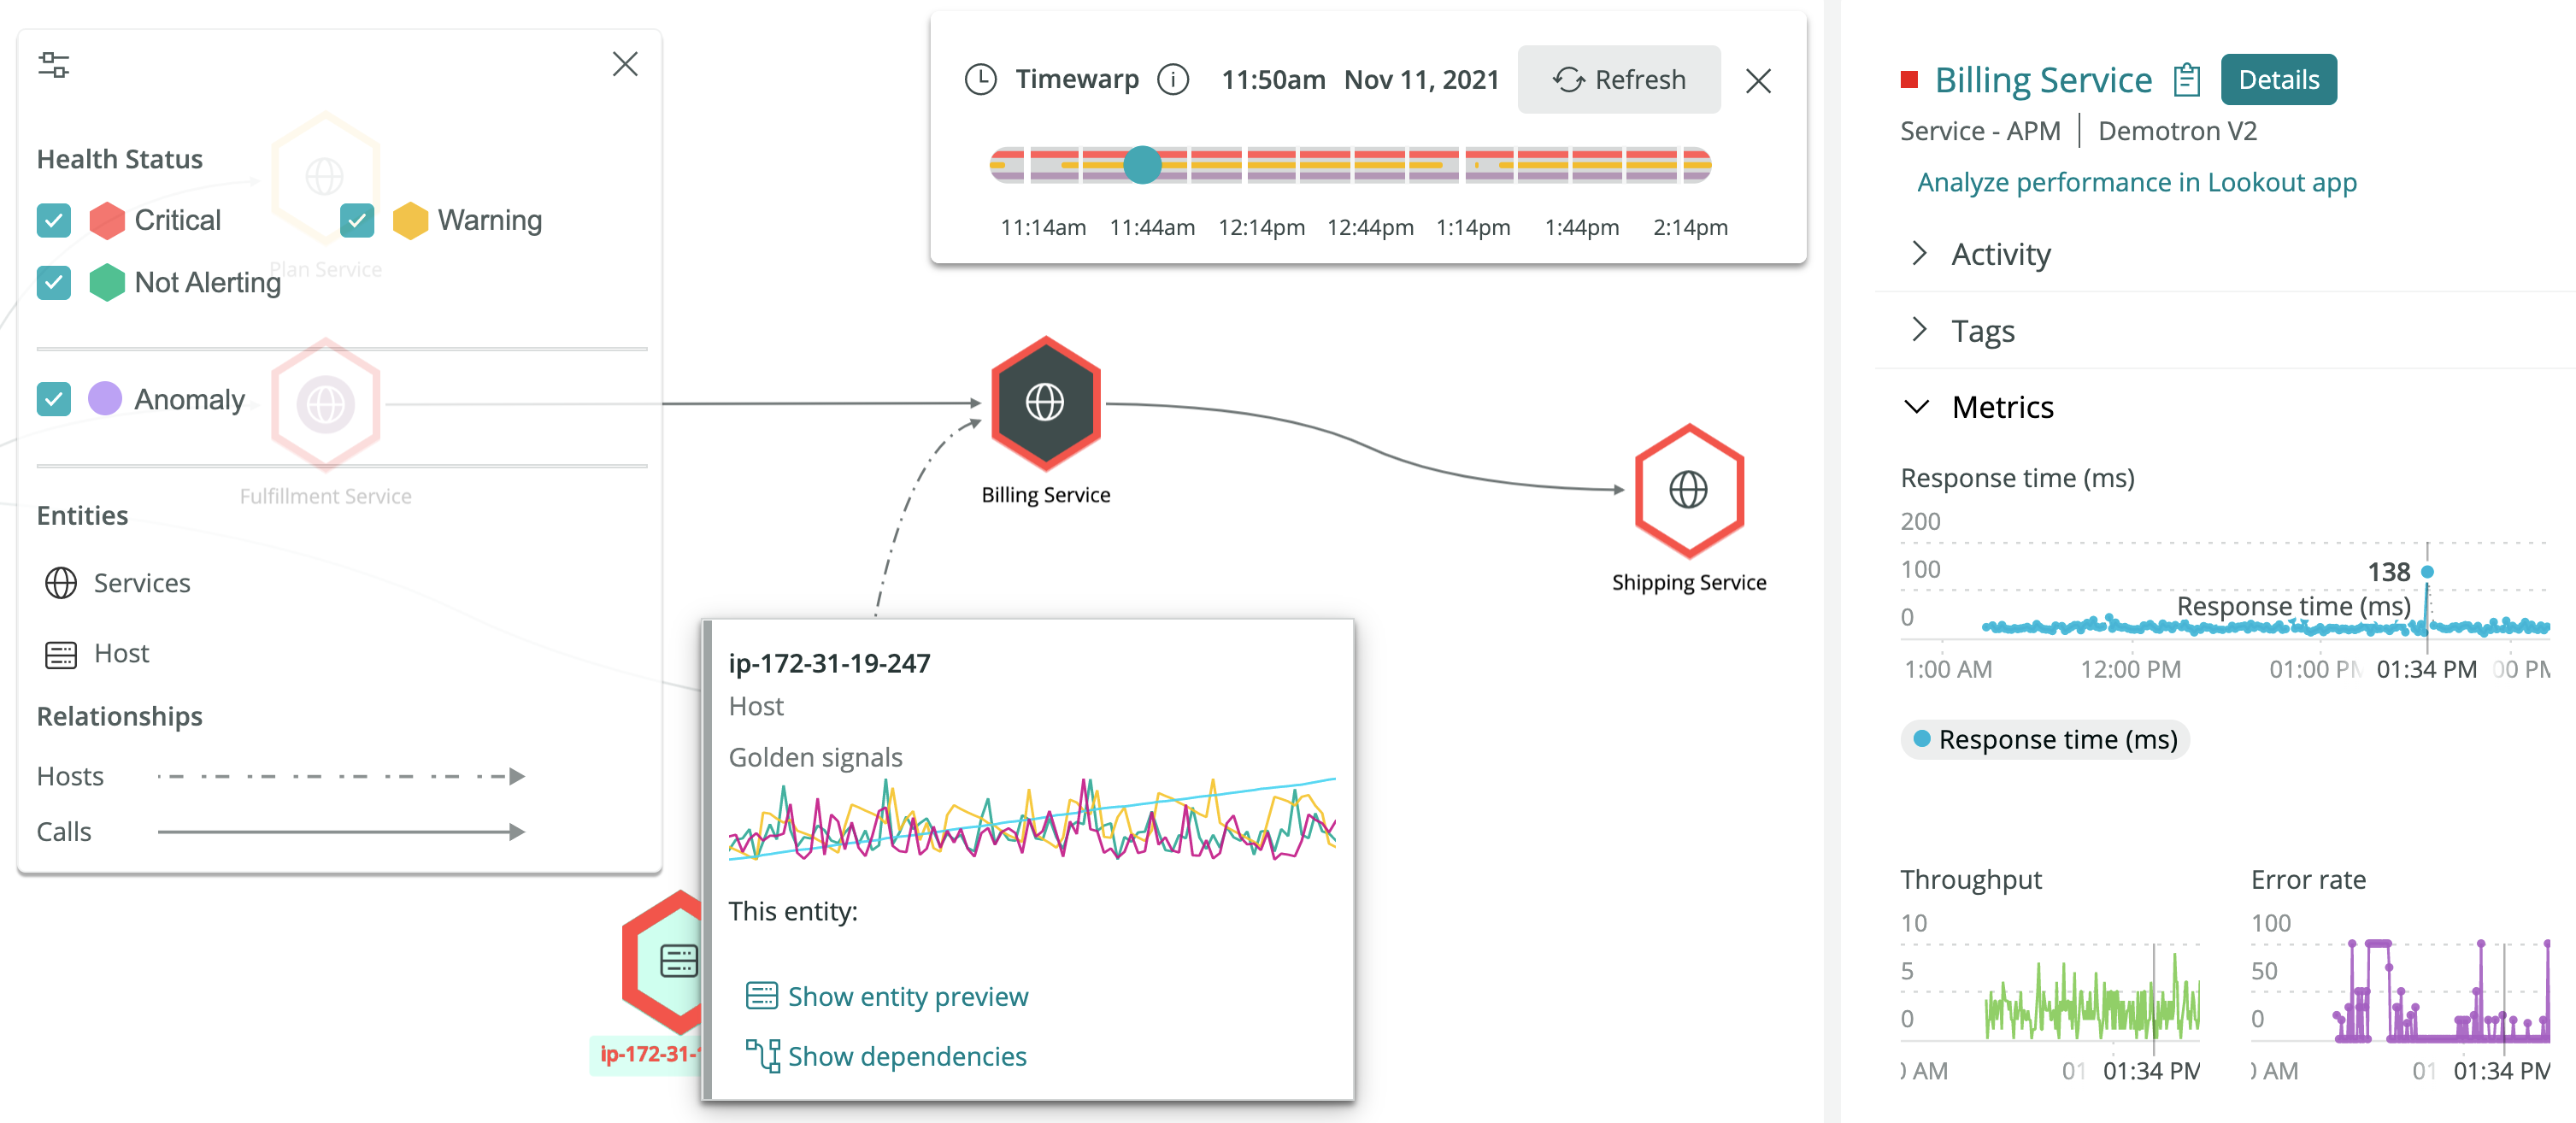
Image Credits: New Relic
“We’ve heard from customers that having everything in one place is really important to them,” New Relic SVP and product GM Alex Kroman told me. “There was some research that we did a while back and the amount of tools that people are using to understand their infrastructure is just incredible.”
Three-quarters of respondents to that survey said they used two tools to monitor their system and just over a tenth said they used more than 10 tools. But as Kroman noted, there is no way for these teams to collaborate across all of these tools when there is an incident and every group uses its own insular tool for their piece of a large distributed system.
“Getting infrastructure updated and brought into the NR one platform and connected into everything else and all the other capabilities that we can overlay on top of it, like AI ops, was really important for our customers,” said Kroman. He noted that in addition to integration infrastructure monitoring with its AI-driven Lookout tool for monitoring changes to a system in real time, the team also created a new user experience, a new mapping feature that maps infrastructure pieces to the services that run on top of its and more.
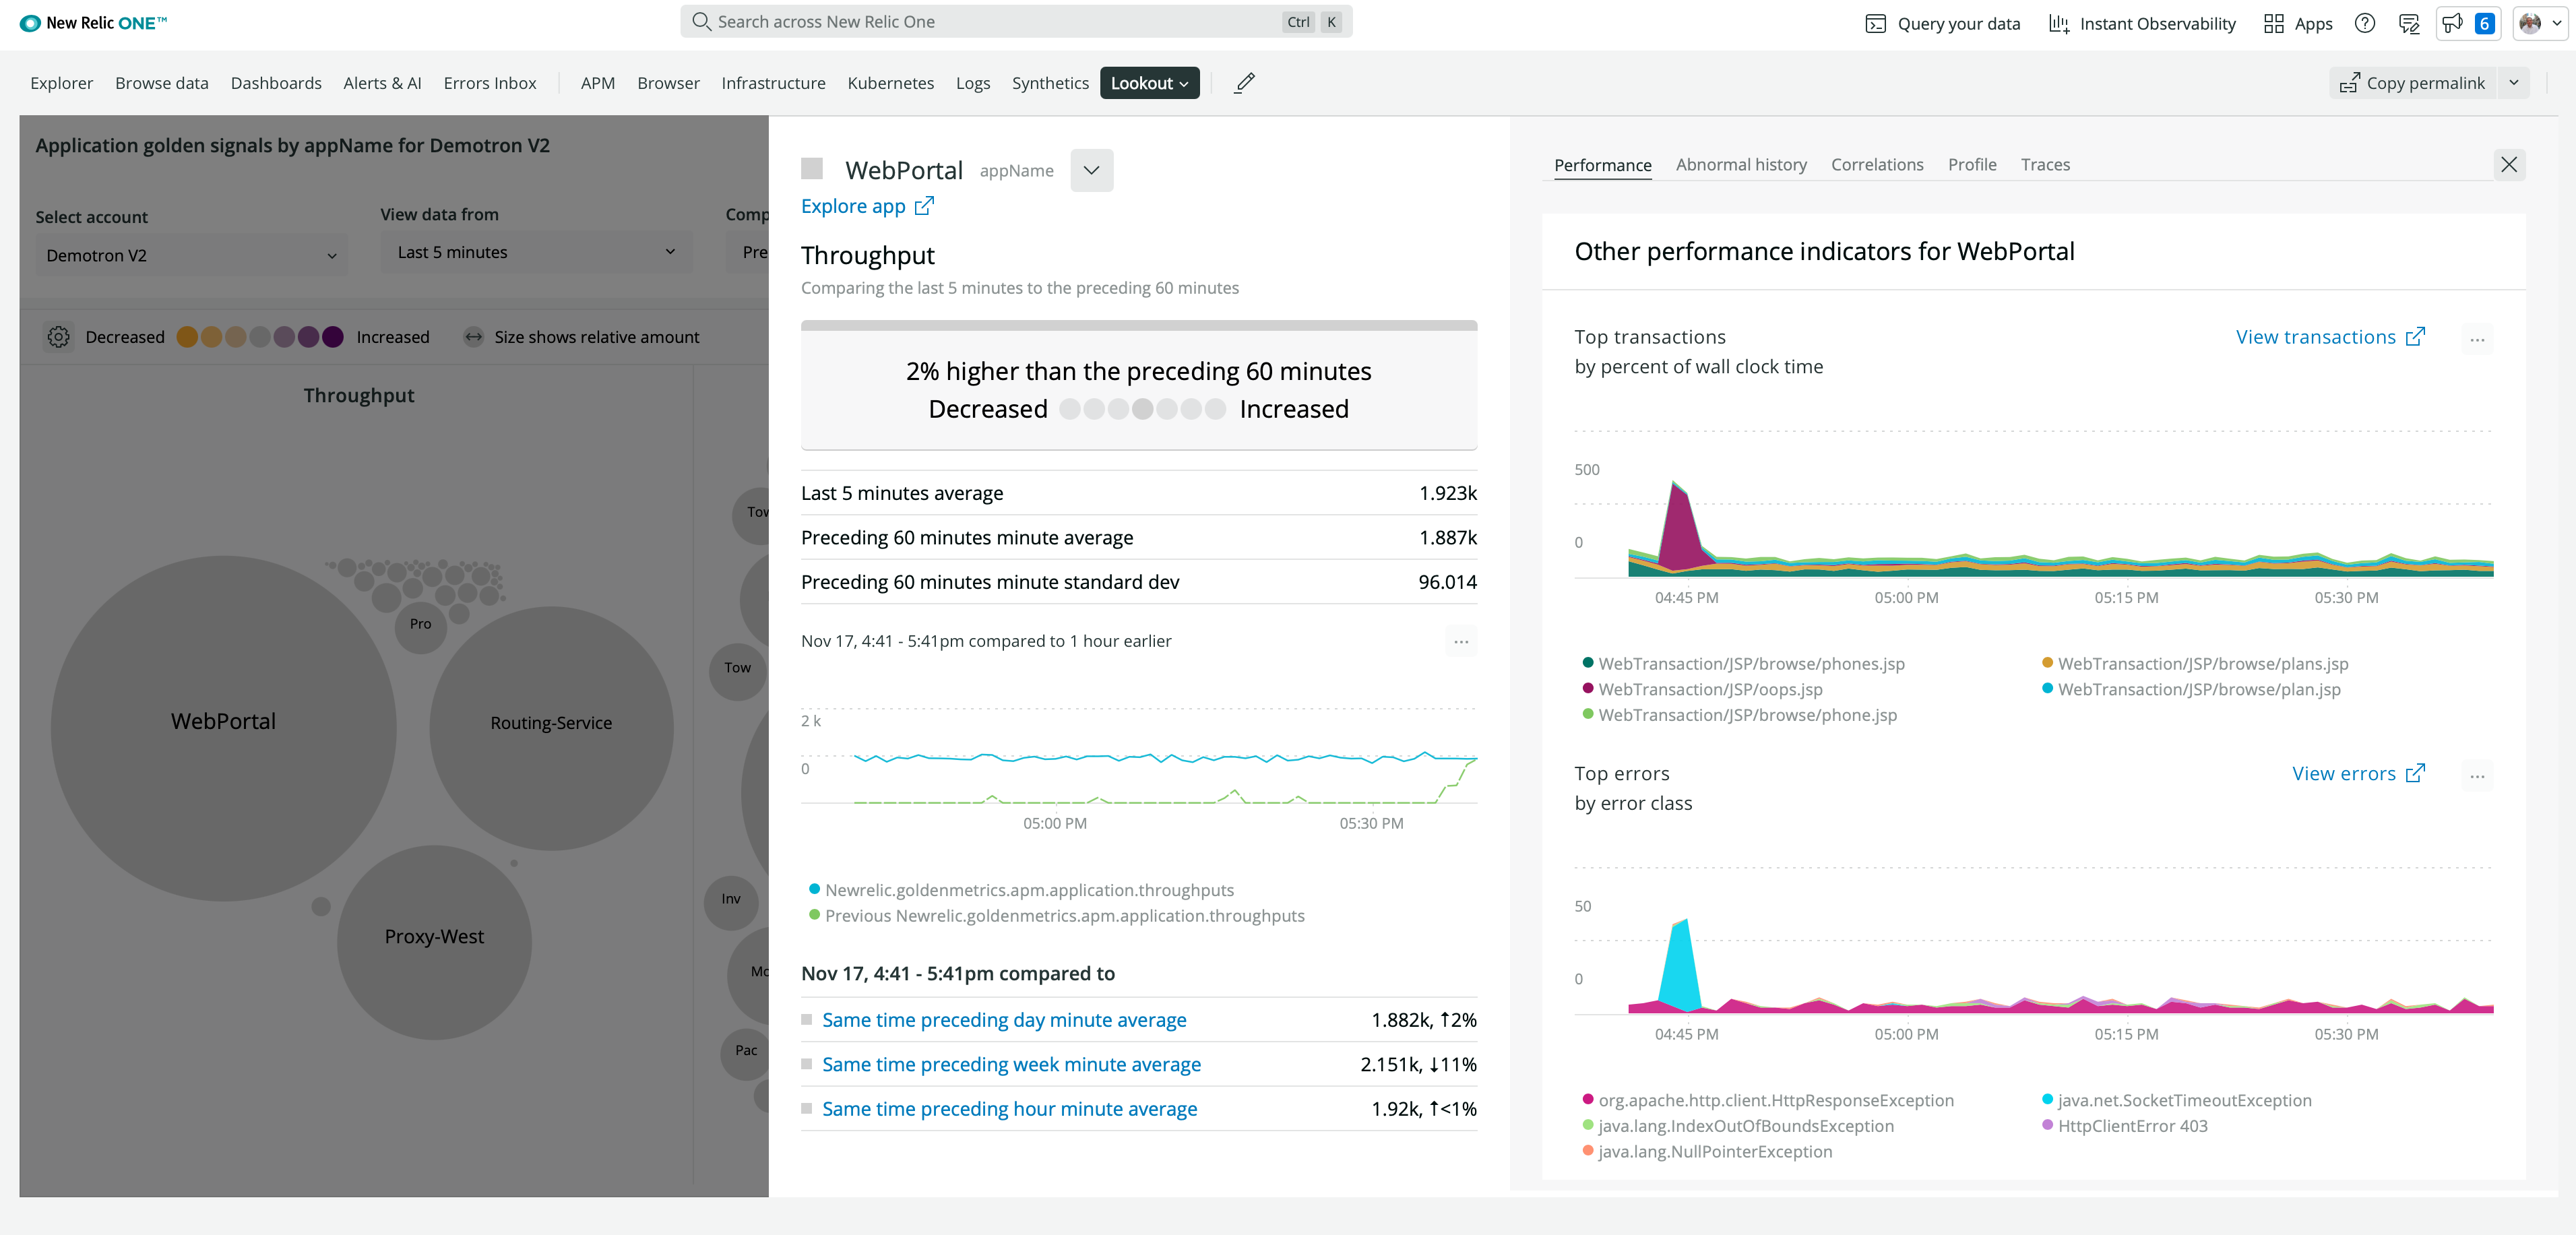
Image Credits: New Relic
Those kinds of insights will only become more important for infrastructure teams going forward, New Relic argues, as the complexity of everybody’s deployments continues to increase as enterprises adopt new technologies and do so faster than ever before. A typical customer, Kroman said, now monitors well over 100 different entity types. “The amount of complexity that we’ve seen in the space over the last few years and how that’s grown technically has been impressive to see,” he said. “But not only has the technological complexity increased, I think you’ve also seen the organizational complexity increase.”
“With this launch, infrastructure has been leveled up to New Relic One’s industry-leading experiences such as APM, Logs, Errors etc.,” said New Relic CEO Bill Staples. “We have received exciting feedback from our early-access customers, many of whom are replacing their incumbent solutions with New Relic One. I can’t wait for all our customers to follow and get more value from their investment in our platform.”