
For the last decade, private company executives have all asked us the same question:
“Do public market investors prefer profitability or growth?” While the answer to that question is not simple, the recent trends in the data are clear.
In 2021, profitability — measured by free cash flow (FCF) margins — not revenue growth, had the higher correlation to positive stock returns in the software sector.
This broke a four-year trend of revenue growth being the more important driver of software company stock performance.
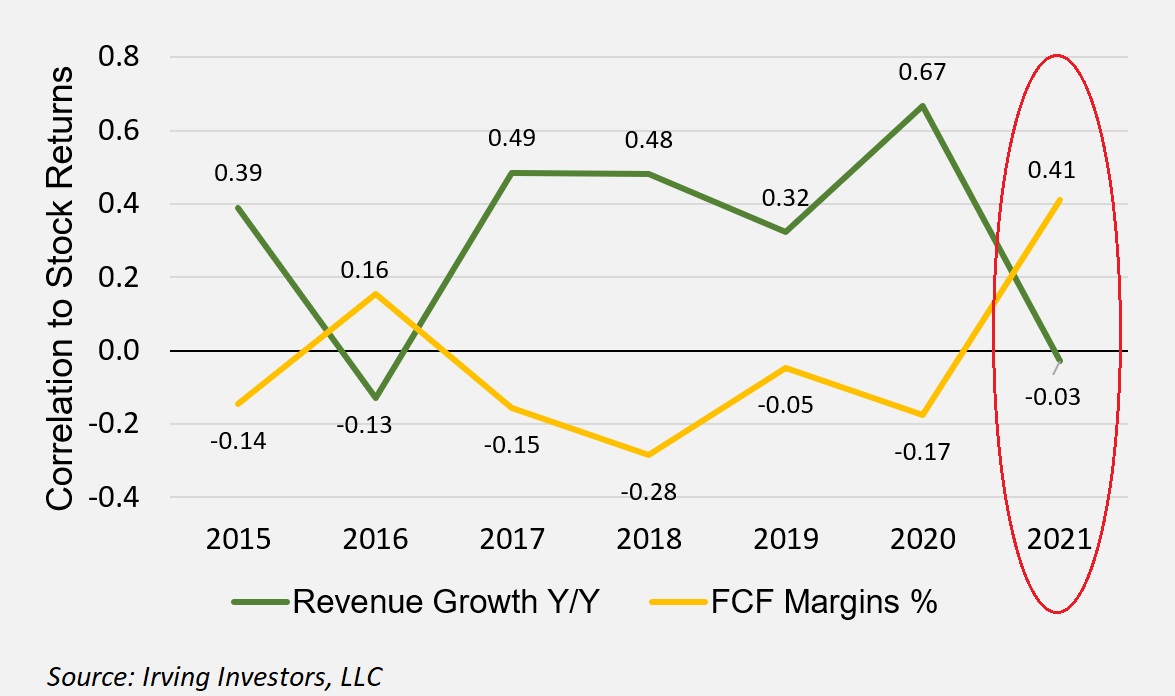
In 2021, profitability, not revenue growth, had the higher correlation to positive stock returns in the software sector. Image Credits: Irving Investors
This correction is big. And the reversal in investor sentiment is clear.
In addition to deviating from the four-year trend, the data shows profitability correlation hit a seven-year high at the end of last year, while revenue growth correlation was close to a seven-year low. With the continued selloff, revenue growth correlation broke well below the seven-year historic low, and profitability correlation stayed at record highs.
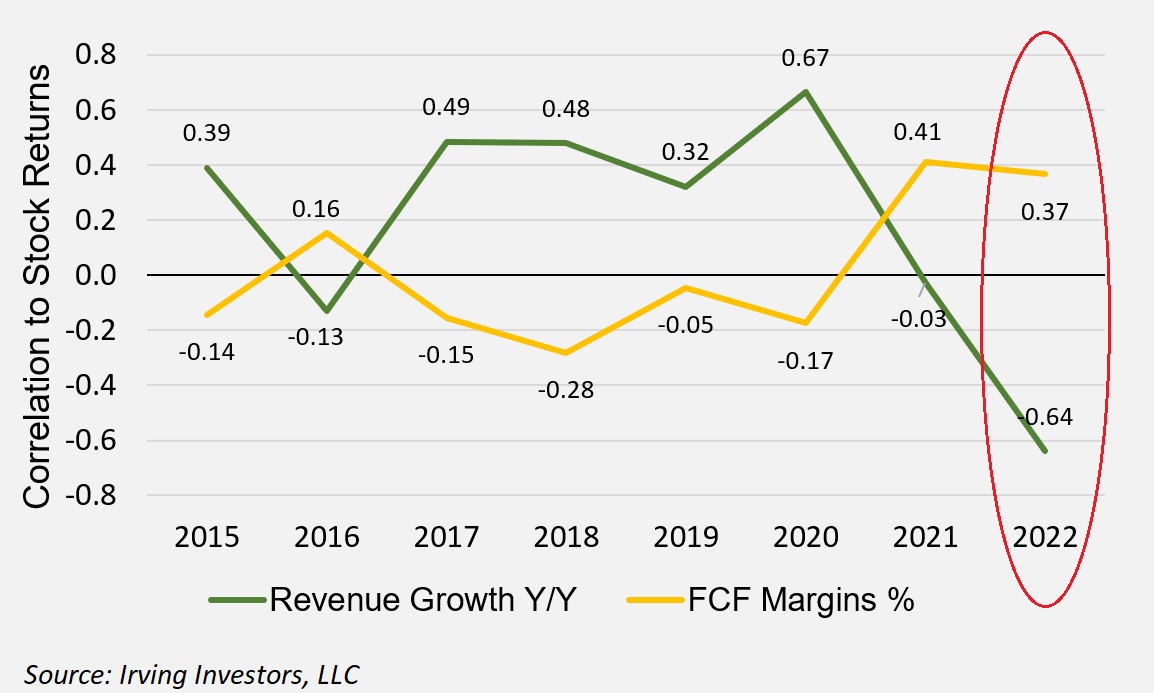
Revenue growth correlation broke well below the seven-year historic low and profitability correlation stayed at all time highs. Image Credits: Irving Investors
What’s happening?
So far in 2022, the S&P 500 and Dow Jones have significantly outperformed the tech-heavy Nasdaq. Additionally, a number of recent high-profile/high-growth/unprofitable IPOs have broken IPO price (Hashicorp, Sweetgreen, Rivian Automotive, Rent the Runway, etc.).
The Bessemer Emerging Cloud Index (made up of prominent SaaS companies) is down over 30% from its November 2021 peak, while some high-multiple names like Cloudflare and HubSpot are down about 50% from their peaks. Broad SaaS valuation multiples over the same period have adjusted from a peak of about 17.5x NTM EV/Rev in November 2021 to about 10.5x.
Investors are “rotating” out of high-growth/high-multiple software names into sectors like finance (banks) and insurance, which benefit from rising interest rates. Also, it is important to note that big, slower-growing, more profitable tech stocks like Microsoft, Google and Facebook have corrected, but to a much smaller degree.
This shift has been fast, resolute and extreme.
Why are investors selling high-growth stocks?
As the market turns and volatility increases, investors retreat to names they are comfortable with.
Interest rates are increasing
Inflation is rising, which led the U.S. Federal Reserve to signal three or four interest rate hikes in 2022, which has caused the 10-year treasury yield to rise from about 1.5% in the beginning of the year to about 1.9% today, an around 40bps increase. As interest rates go up, investors focus more on profitability (or a derivative of profitability; Rule of 40 or Magic Number).
High-growth, unprofitable companies are the most sensitive to rate changes. This is because their present value is based on cash flows projected far in the future and then discounted back against the cost of capital (higher rates = higher cost of capital), compounded between now and that distant future date. Simply put, a dollar today is worth more than a dollar tomorrow.
However, remember that the drop in rates over the last few years contributed to the meteoric rise in valuation multiples, especially as high-growth stocks are valued on a multiple of sales, not earnings.
Investment dollars are spread thinner
There were 68 software IPOs in 2021, along with record late-stage venture capital investment activity. All this means that capital is now spread between more public stocks and there is more capital in private tech companies.
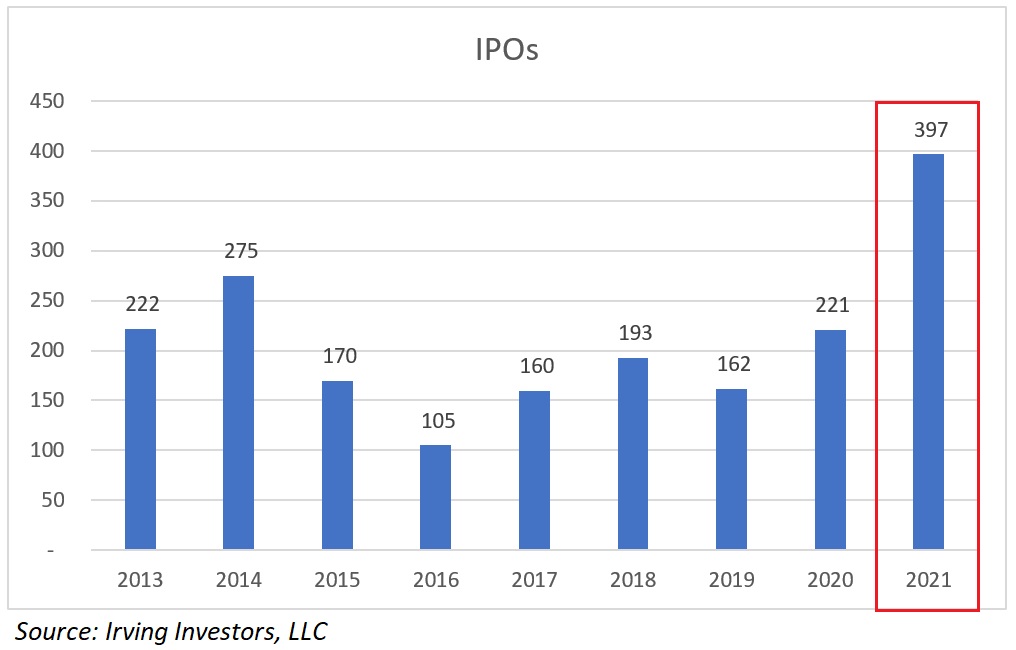
Image Credits: Irving Investors
As the market turns and volatility increases, investors retreat to names they are comfortable with. Comfort is achieved over time, so investors rotate into names that have been public longer and generally have higher margins like Salesforce, Palo Alto Networks and others.
The high-growth/low-profitability/lesser-known companies are getting sold first. This is another good reason for building relationships with your long-term investor base before you go public. You can build comfort and connect with public market investors before becoming a public company.
Profitability versus growth
Growth always wins. But the challenge for investors is assessing how durable and sustainable the growth is. They want to know if they can count on a company to keep growing through and past its ability to start turning a meaningful profit. If the answer is yes, the best returns will be found with the companies growing the fastest.
How to focus on profitability
The best indicator of future profitability is how efficiently a company spends to grow.
Getting a real feel for the trends in a company’s return on spend gives investors an idea of how much meat is left on the bone.
There is a direct correlation between addressable market penetration and the cost to grow, acquire customers or upsell current customers. Generally, the higher a company’s penetration, the more expensive it’ll be to grow. A company can say it has minimal market penetration, but if it becomes increasingly expensive to grow early on, investors will challenge the penetration claim or the addressable market claim. Efficiency of spend provides insight into a company’s ability to responsibly expand market share.
This is not simple to quantify, and can be even harder to project. Most companies calculate return on spend differently. Additionally, a back-of-the-envelope metric doesn’t adequately tell the story, as it is important to understand return on spend in the context of a company’s evolution. It is critical to understand the categorizations, different cohorts, segmentations, upsell/repeat rates, channels, expansion efforts and experimentation.
If given the opportunity to dive deep, we still look to roll up the data into a metric that can be comparable to other companies. Apples-to-apples comparisons are hard to come by, but the following are some of our favorite metrics as the profitability versus growth dynamic continues to play out:
LTV/CAC
LTV stands for “lifetime value” and CAC stands for “customer acquisition cost.” While we never take this metric at face value because it’s often manipulated, the concept behind it may be the most important indicator of scalability and the ability to sustain growth.
This metric tells a company how profitable a customer will be. It should not only be tracked for all existing customers, but should be projected against all new customers acquired as well. The LTV/CAC projection should be the driver of all spending decisions. It’s how you determine if one dollar spent is more efficient than another. We generally like to see a real LTV:CAC ratio of 3:1 or better, but again we challenge every company’s calculation before accepting it.
Rule of 40
This metric is primarily used for SaaS businesses but can be extrapolated to other industries.
Rule of 40 = Revenue growth % + FCF% or EBITDA%.
This metric is telling, because it adjusts for increases or decreases in growth spending, and exposes the integrity and effectiveness of spending decisions.
It’s simple: 1% of top-line growth is equal to 1% of FCF or EBITDA margin expansion. So if a company decides to spend more to increase growth, the Rule of 40 will integrate both the change in growth and the change in profitability.
Spending is efficient when a company’s Rule of 40 number doesn’t change much, which means the increase in top-line growth is similar to the decrease in profitability. If the decrease in profitability is larger than the increase in growth, the Rule of 40 number will drop by the delta.
Conversely, if a company decides to spend less, it will not grow as fast, but its Rule of 40 can stay flat if profitability increases commensurately. Companies should target at least 40%, and numbers below 40% should come with an explanation.
Magic Number
Primarily used for SaaS businesses, this metric measures sales efficiency.
Magic Number = (Current quarter revenue – previous quarter revenue)*4/previous quarter sales and marketing spend.
A magic number of 0.75 or greater is said to be a sign a business should continue investing in customer acquisition, and a number below 0.75 means you should re-evaluate spending.
Companies ask us the question on profitability versus growth as if there is a secret meeting between investors where everyone comes to a black and white consensus on which is the preference de jour. The truth is that investor success is found in the diligent pursuit of understanding how responsibly a company is spending to grow in order to predict how the company will be able to drive profit in the future.