
Following a record-breaking second quarter, venture capitalists around the world stayed busy in Q3, investing astronomical sums into global startups.
Since the back half of 2020 kicked off and the venture capital and startup worlds discovered that COVID and its related economic impacts were largely set to miss the upstart technology market, investors have been busy stuffing ever-larger amounts of cash into new companies around the world. The acceleration of capital deployment has generated more unicorns, more mega-rounds and simply more available dollars than ever before in the history of startups.
The deluge of record venture capital data points can be difficult to put into context at times. In the coming weeks, TechCrunch will explore the global Q3 venture capital market’s results in detail, by business genre (fintech, edtech, etc.) and geography, along with notes on stage-by-stage data and more.
Today, however, we’re taking a high-level look. Thanks to a fresh report from CB Insights, we have a sheaf of numbers to unpack. To start, we’re looking at the third quarter from four perspectives: Alex will look at aggregate numbers, Mary Ann will provide an overview of unicorn results, Anna is looking into geographic outliers and Ryan has notes on fintech.
Lots to come, but this is the first look. Let’s get into the data!
All-time record venture capital activity
After some $156 billion was invested into global startups in the second quarter, the third quarter managed to just top the record by $2 billion, as investors put $158 billion to work in the last three months. The numbers are effectively a tie, meaning that we’ve just lived through the two strongest periods for investment into private companies in the history of startups.
This year is looking simply superlative.
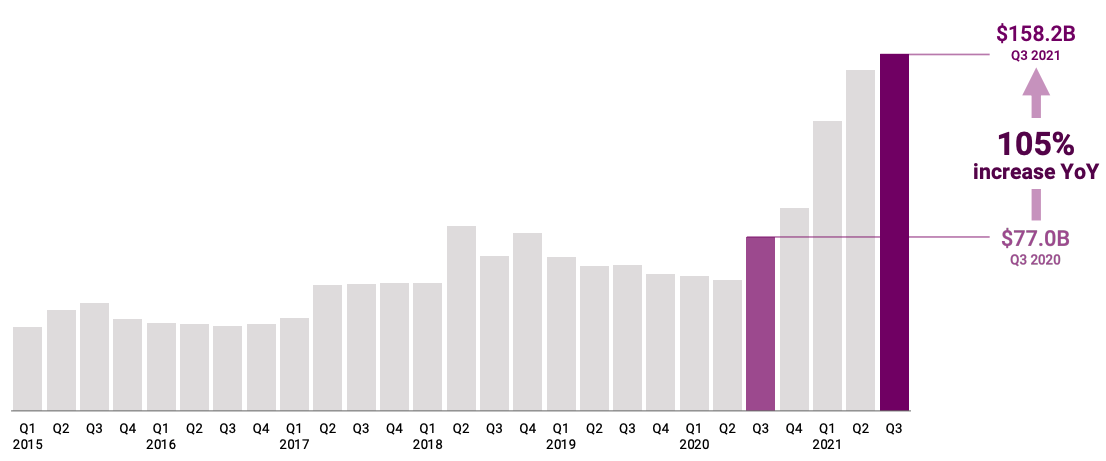
Image Credits: CB Insights
We’ll chat unicorns in a moment, but the funding that helped keep the cohort of richly valued private companies alive and growing was enormous. Some 409 deals worth $100 million or more were announced in Q3, up from 390 in the second quarter. That’s around 4.5 per day, a data point that should help frame how busy things have been on the TechCrunch side of the fence. Just keeping up with nine-figure rounds has been tough; throw in the rest and it’s a flat-out scramble.
But while the dollars at play have gone up, where they are landing may not be changing as rapidly as you expected. The United States remains incredibly dominant, with $72 billion in investment during the third quarter, a slight upgrade from the $70 billion the U.S. racked up in the preceding period. So while the global market for startup deal-making has expanded greatly in recent years, boosting historically overlooked geographies, the traditional lead market has held onto its prominence.
Other markets also did well, including India, China and startups focusing on health tech, fintech and more. The result of all that money? More unicorns.
The unicorn stampede continues
The number of companies valued at over $1 billion, unsurprisingly, continues to climb. CB Insights data shows that the world got 127 new unicorns in the third quarter — bringing the total number to 848.
It marks the third straight quarter that unicorn births were over 100, according to CB Insights’ report.
The majority of those new unicorns, 69, are located in the United States. Asia was home to the second-highest number at 30. Currently, the U.S. is home to 429 total unicorns while Asia has 271.
Interestingly, though, the most valuable of the three newly minted unicorns were based outside of the United States. And, they were all fintechs.
Hong Kong-based FTX, a cryptocurrency exchange that offers derivatives, options and other sophisticated products, raised a $900 million Series B in July at a staggering $18 billion valuation. The site boasts over 1 million users, averaging over $10 billion of daily trading volume.
The U.K.’s Zepz (formerly WorldRemit), which operates a digital cross-border payments platform, raised $292 million in August at a $5 billion valuation. That company says it has over 11 million users across 150 countries. In September, French startup Sorare announced that SoftBank’s Vision Fund 2 led its $680 million Series B round, which valued the company at $4.3 billion. Sorare has built a fantasy football (soccer) platform based on NFTs, or non-fungible tokens. Each digital card is registered as a unique token on the Ethereum blockchain. Players can buy and sell cards from other players. Transactions are all recorded on the Ethereum blockchain.
Notably, the median valuation of late-stage deals has hit a “unicorn-minting high” in 2021 so far – at $1.1 billion compared to $523 million in 2020. The median valuation of midstage deals is $286 million year to date, compared to $150 million last year.
Now let’s dig a bit more deeply into the regional distribution of funds.
The U.S. and Asia lead the pack
In Q3, 46% of all dollars went to startups in the U.S. — the most of any region, the report notes. This total of $72.3 billion also represented a 90% year-on-year increase. And it’s not just dollars: The total number of deals (3,210) also broke records.
However, the national breakdown seems more contrasted than last quarter, with Silicon Valley, New York City and Miami on an upward trend, while totals seem to be flattening or slowing down in some other major metropolitan areas. This is something we’ll want to look into as we dive deeper into trends.
Another thing we vowed to look into was the evolution of funding in Asia, particularly in China, where we were curious to check on the impact of regulatory shifts.
Well, the numbers have spoken, as Asia funding dollars rose 95% year on year and not just thanks to India: In China, too, both dollar volume and deal count reached new highs last quarter. While funding numbers always have an element of delay, the fact that the share of early-stage deals in the country rose to 58% this year to date seems to indicate that there’s more than just lag.
In contrast with the U.S. and Asia, funding was down in Europe, Latin America and Canada in Q3 compared to Q2 of this year. But taking a step back and looking at dollar volume for this year to date, all three of them were up compared to 2020 — so it might just be a matter of deal-making not being evenly distributed throughout the year.
Fintech investment dips slightly but remains elevated
Fintech as a category continued to be a bright spot in the venture world, as dollars invested in fintech startups through the first three quarters of 2021 have nearly doubled the amount committed through all of 2020.
According to CB Insights, $91.5 billion has been invested in fintech startups over 3,514 deals through Q3 2021. That’s compared to $47.2 billion invested over 3,404 deals all of last year.
In the third quarter, the number of deals and amount invested in fintech was slightly down from the previous quarter, but not dramatically so. There was $31 billion invested in fintech startups over 1,178 deals in the third quarter, compared to $34.8 billion over 1,192 deals in the previous quarter. But that’s up substantially from the previous year’s third quarter, when investors poured $11.9 billion into 830 fintech deals.
The U.S. continues to be the largest market for fintech investment, with $14.4 billion committed here in the third quarter, compared to $6.0 billion in Asia, $5.4 billion in Europe and $2.6 billion in Latin America.
While it’s clear that we’ll end 2021 with an increase in the number of deals done, the big difference in funding totals comes from the average amount being committed by investors in each deal. CB Insights found that the average fintech deal size through 2021 was $31 million (median $5 million), compared to an average deal size of $18 million (median $4 million) in the previous year.
Like we said, a deluge of numbers. We’re beginning to see why it feels so busy out there. It is!