
Cohort analysis is a way of evaluating your business that involves grouping customers into “cohorts” and observing how they behave over time. A commonly used approach is monthly cohort analysis, where customers are grouped by the month they signed up, allowing you to observe how someone who joined in November compares to someone who signed up the month before.
Cohort analysis gives you a multivariable, forward-looking view of your business compared to more simple and static values like averages or totals.
Cohort analysis is flexible and can be used to analyze a variety of performance metrics including revenue, acquisition costs and churn.
Let’s imagine you’re the CMO of the “Bluetooth Coffee Company.” You sell a tech-enabled “coffee composer” that brews coffee, tracks consumption and orders replacement coffee when users are running low. The longer your customers are subscribers, the more money you make. You recently ran a Black Friday feature on a popular deals site and you’re interested to know if you should run it again.
The chart below is a simple analysis you might do to gauge your marketing performance. It shows the total customers added each month, and a clear spike in November following the Black Friday promotion. At first glance, things look good — you brought in more than double the monthly customers in November compared to October.
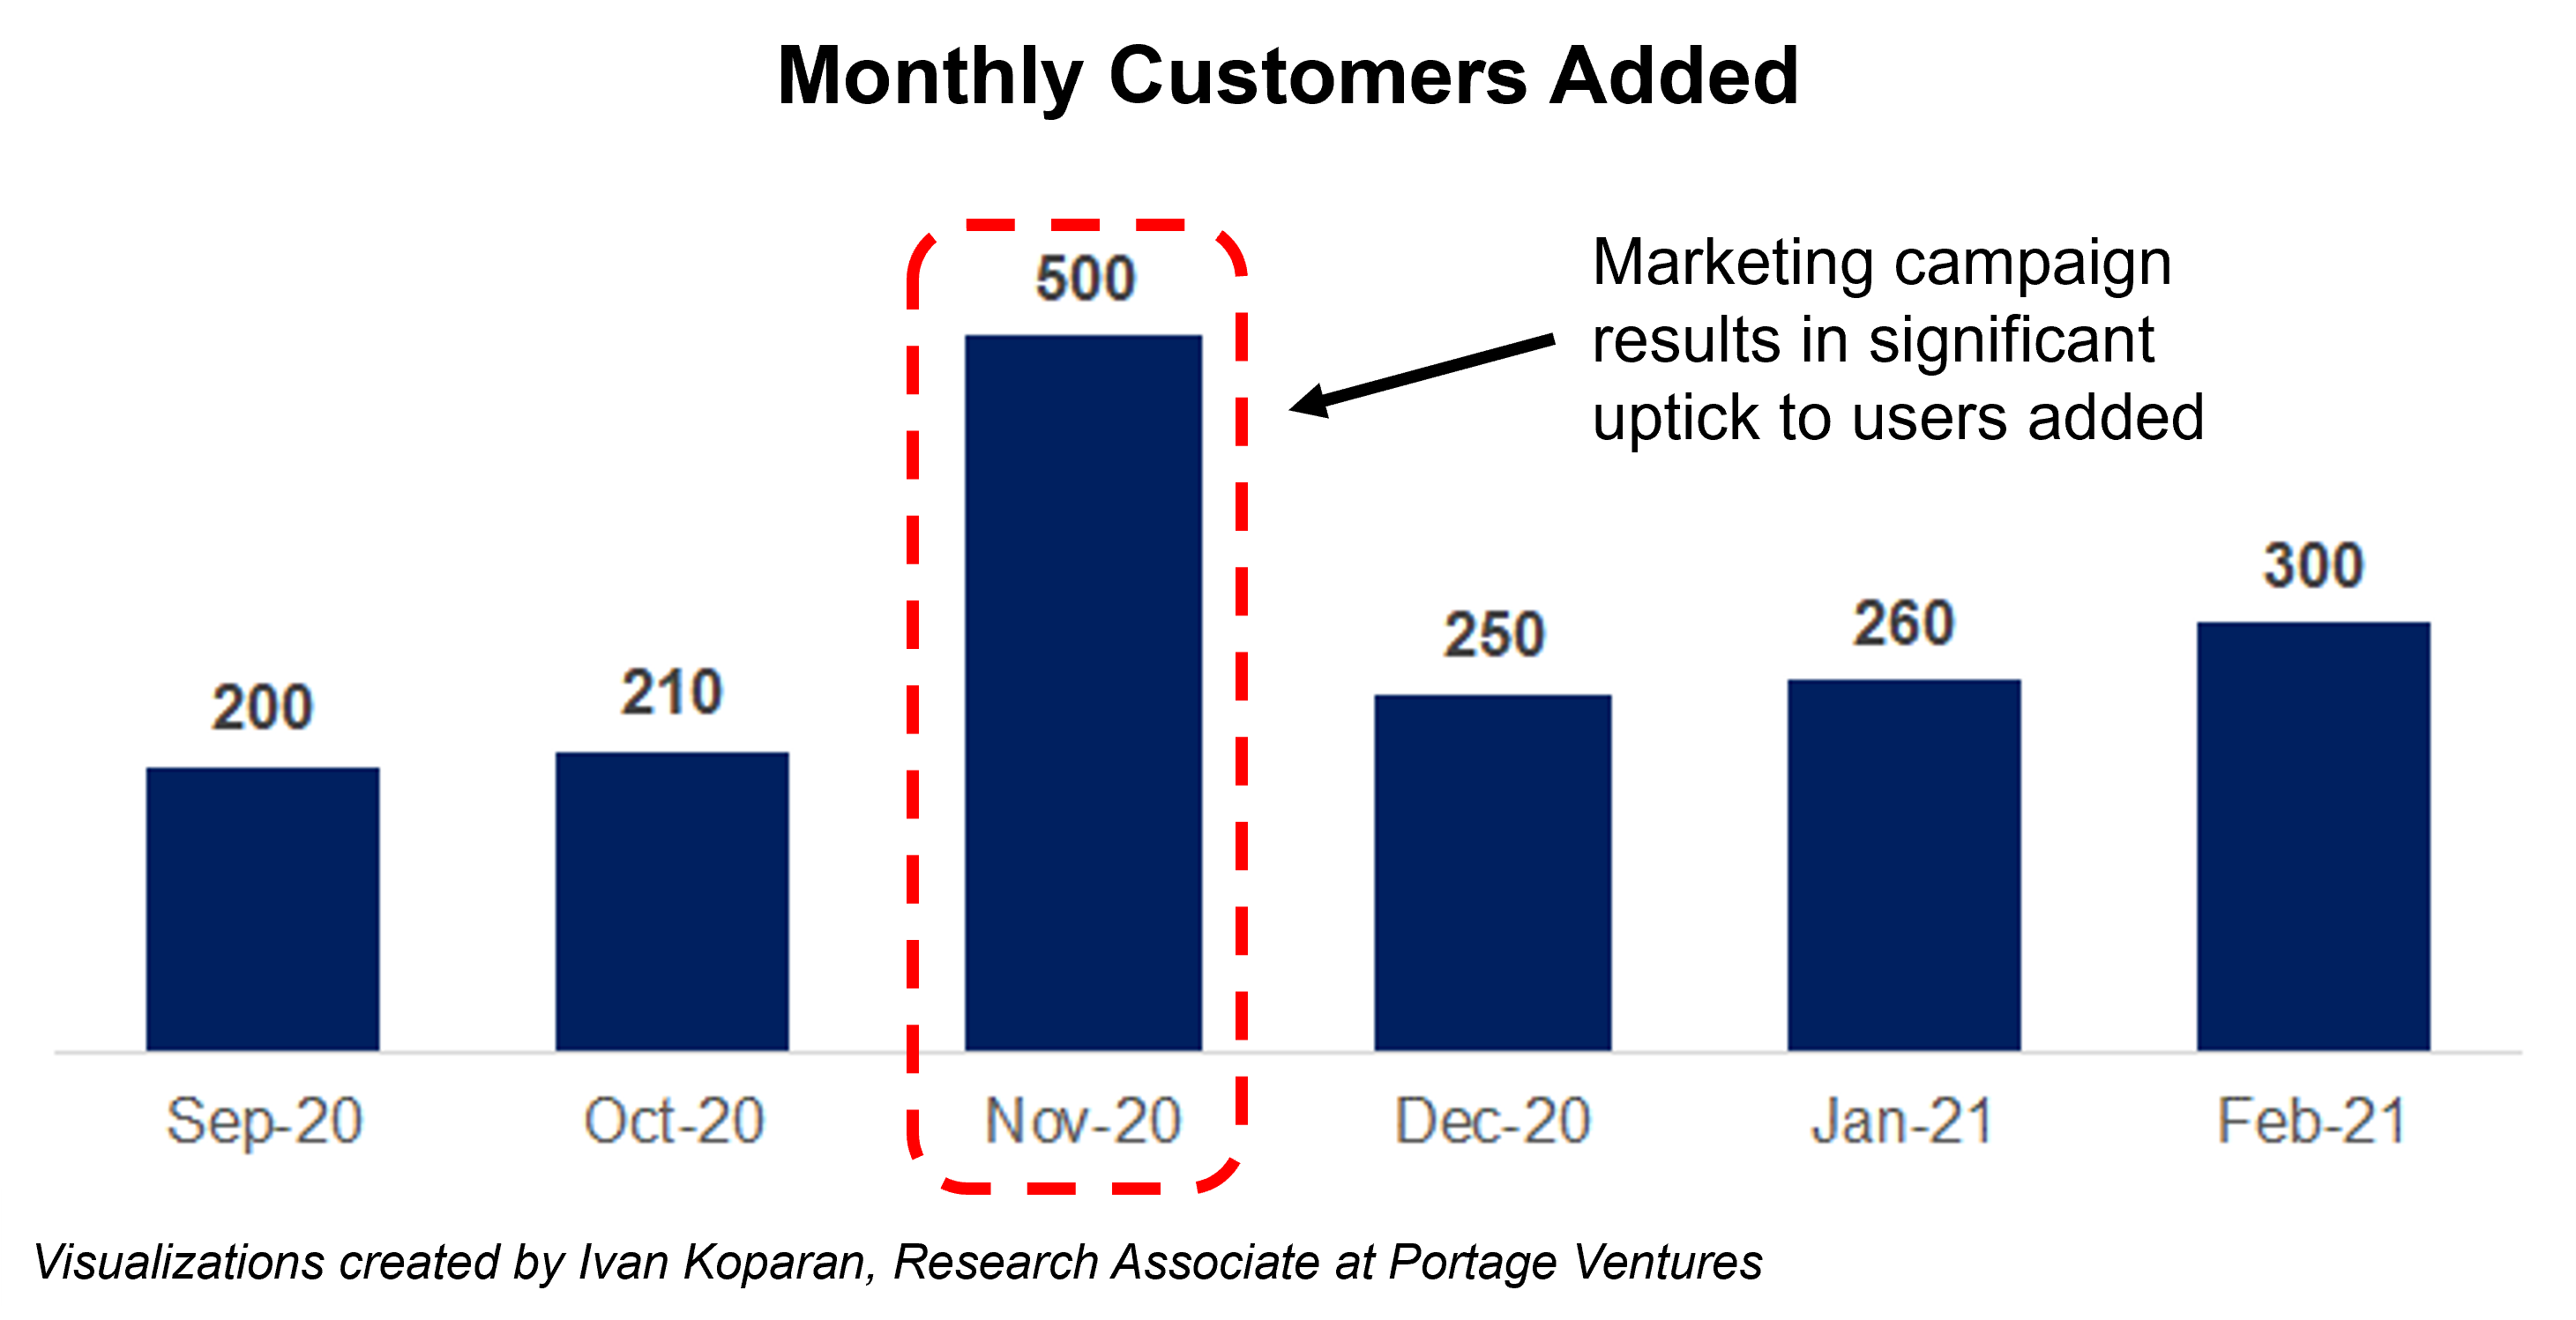
Image Credits: Sagard & Portage Ventures
But before you rebook the promotion, you should ask if these new Black Friday consumers are as valuable as they seem. Comparing monthly customer percentage is a good way to find out.
Below is a monthly cohort analysis of new customers between September 2020 and February 2021. Like our previous chart, we’ve listed the monthly cohort size, but we’ve also included the customer engagement rate (calculated by dividing daily active users by monthly active users or DAU/MAU for each month (M1 is month 1, M2 is month 2, and so on).
We’re hosting a Twitter Spaces chat with contributor Jonathan Metrick
on Tuesday, September 7, at 3 p.m. PDT/6 p.m. EDT.
For details and a reminder, follow @TechCrunch on Twitter
This analysis lets us see how the customer engagement of each monthly cohort compares to the next.
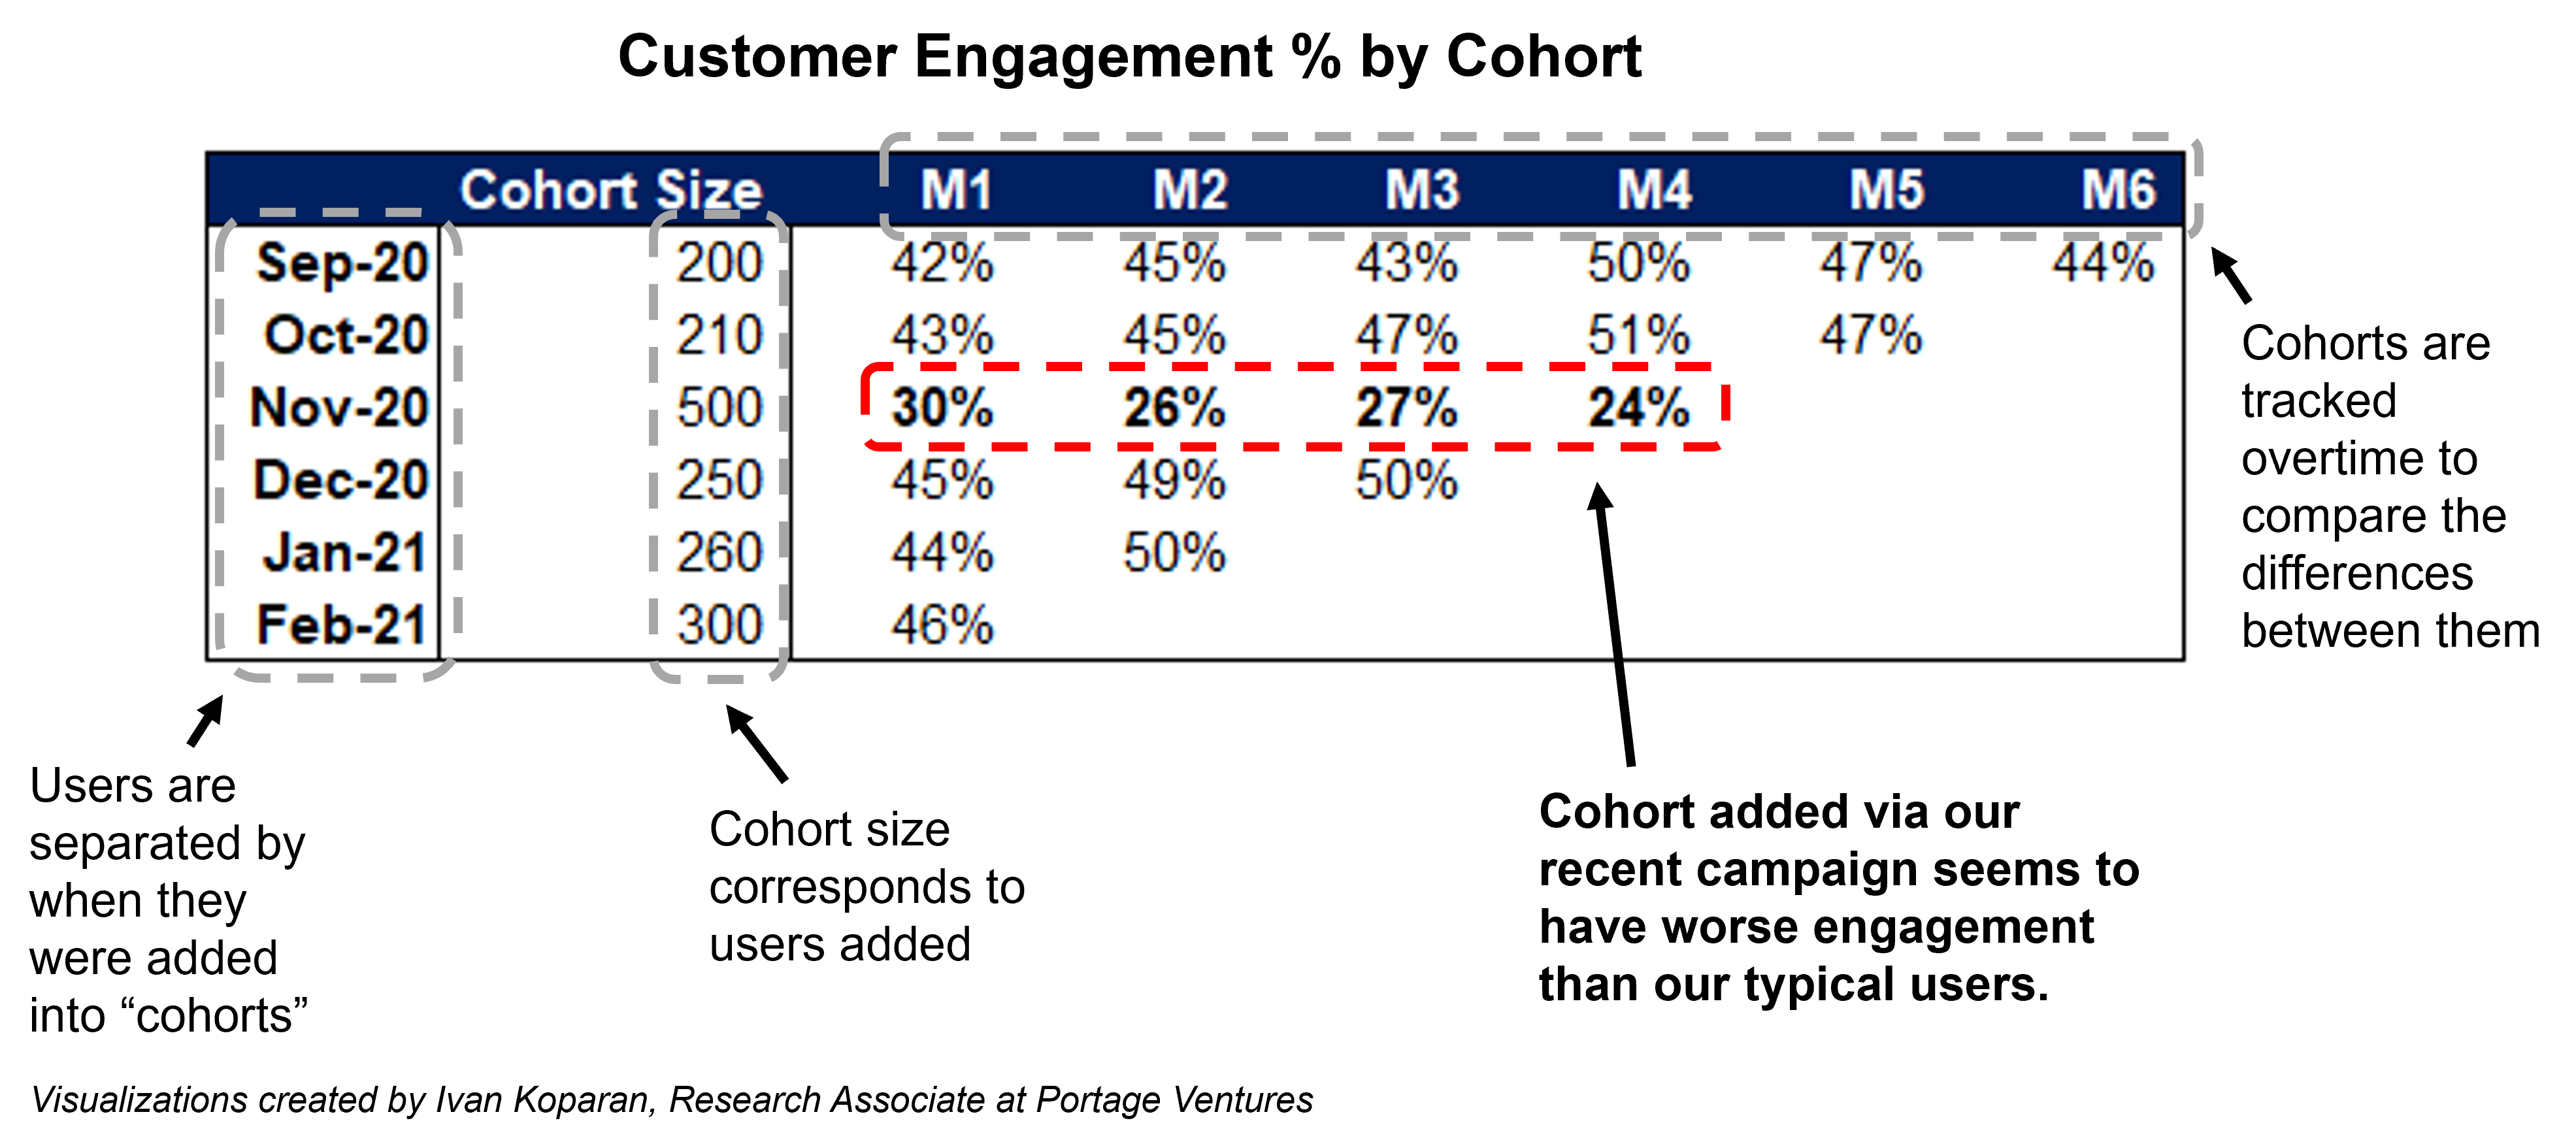
Image Credits: Sagard & Portage Ventures
From the figures above, we see that most cohorts have a customer engagement rate in their first month (M1, 42%-46%), meaning 42%-46% of new customers use the coffee composer everyday. The November cohort however has materially lower engagement (M1, 30%), and remains lower in subsequent months (M2, 26%) and (M3, 27%). Interestingly, the customer engagement rate only drops with the November cohort, returning to normal with the December cohort (M1, 45%).
Engagement analysis shows us that despite generating a larger cohort, the consumers from the Black Friday promotion are drinking less coffee and might be less valuable over time.
Customer retention and other useful cohort analysis
Cohort analysis is flexible and can be used to analyze a variety of performance metrics including revenue, acquisition costs and churn. We already know the November 2020 Black Friday cohort has lower engagement, but let’s see how that impacts customer retention and churn.
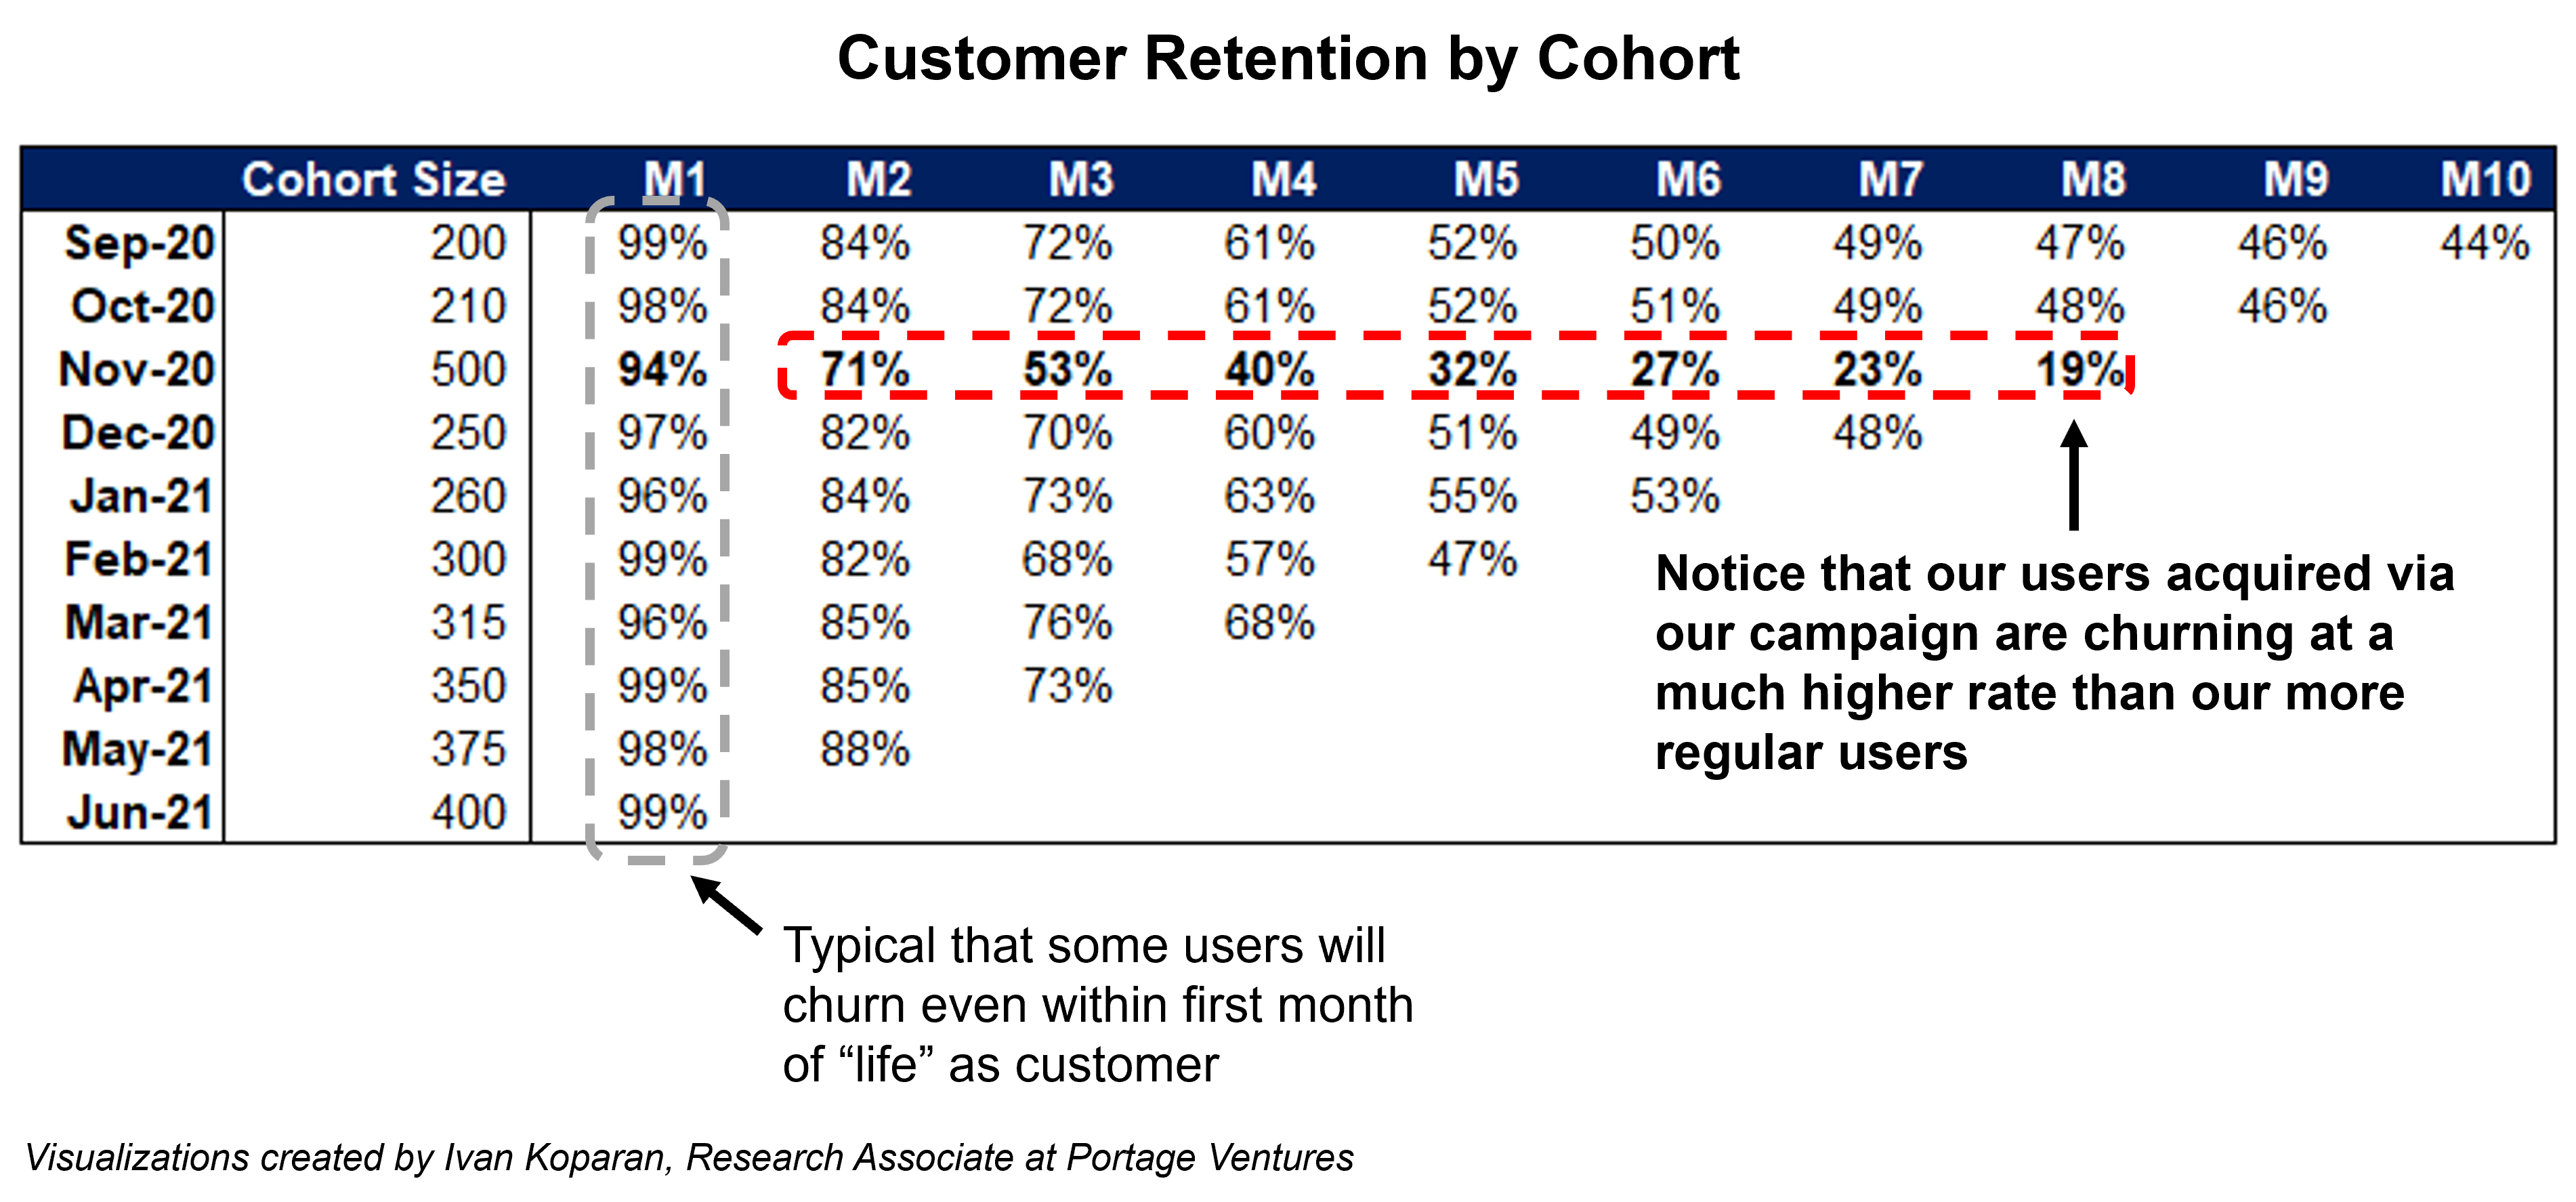
Image Credits: Sagard & Portage Ventures
Above we can see that the November cohort has similar customer retention in the first month (M1, 94%) compared to October (M1, 98%). Retention drops however to only 19% in M8 compared to 48% for customers acquired in October. It appears the lower engagement rates of the Black Friday cohort likely translated into lower customer retention and higher churn as well.
Unsurprisingly, one of the most common cohort analyses is looking at average revenue per user (ARPU). This allows a company to more clearly understand the lifetime value of its customers and if they generate more or less revenue as they age. Let’s look at the impact on ARPU by Bluetooth Coffee’s Black Friday cohort.
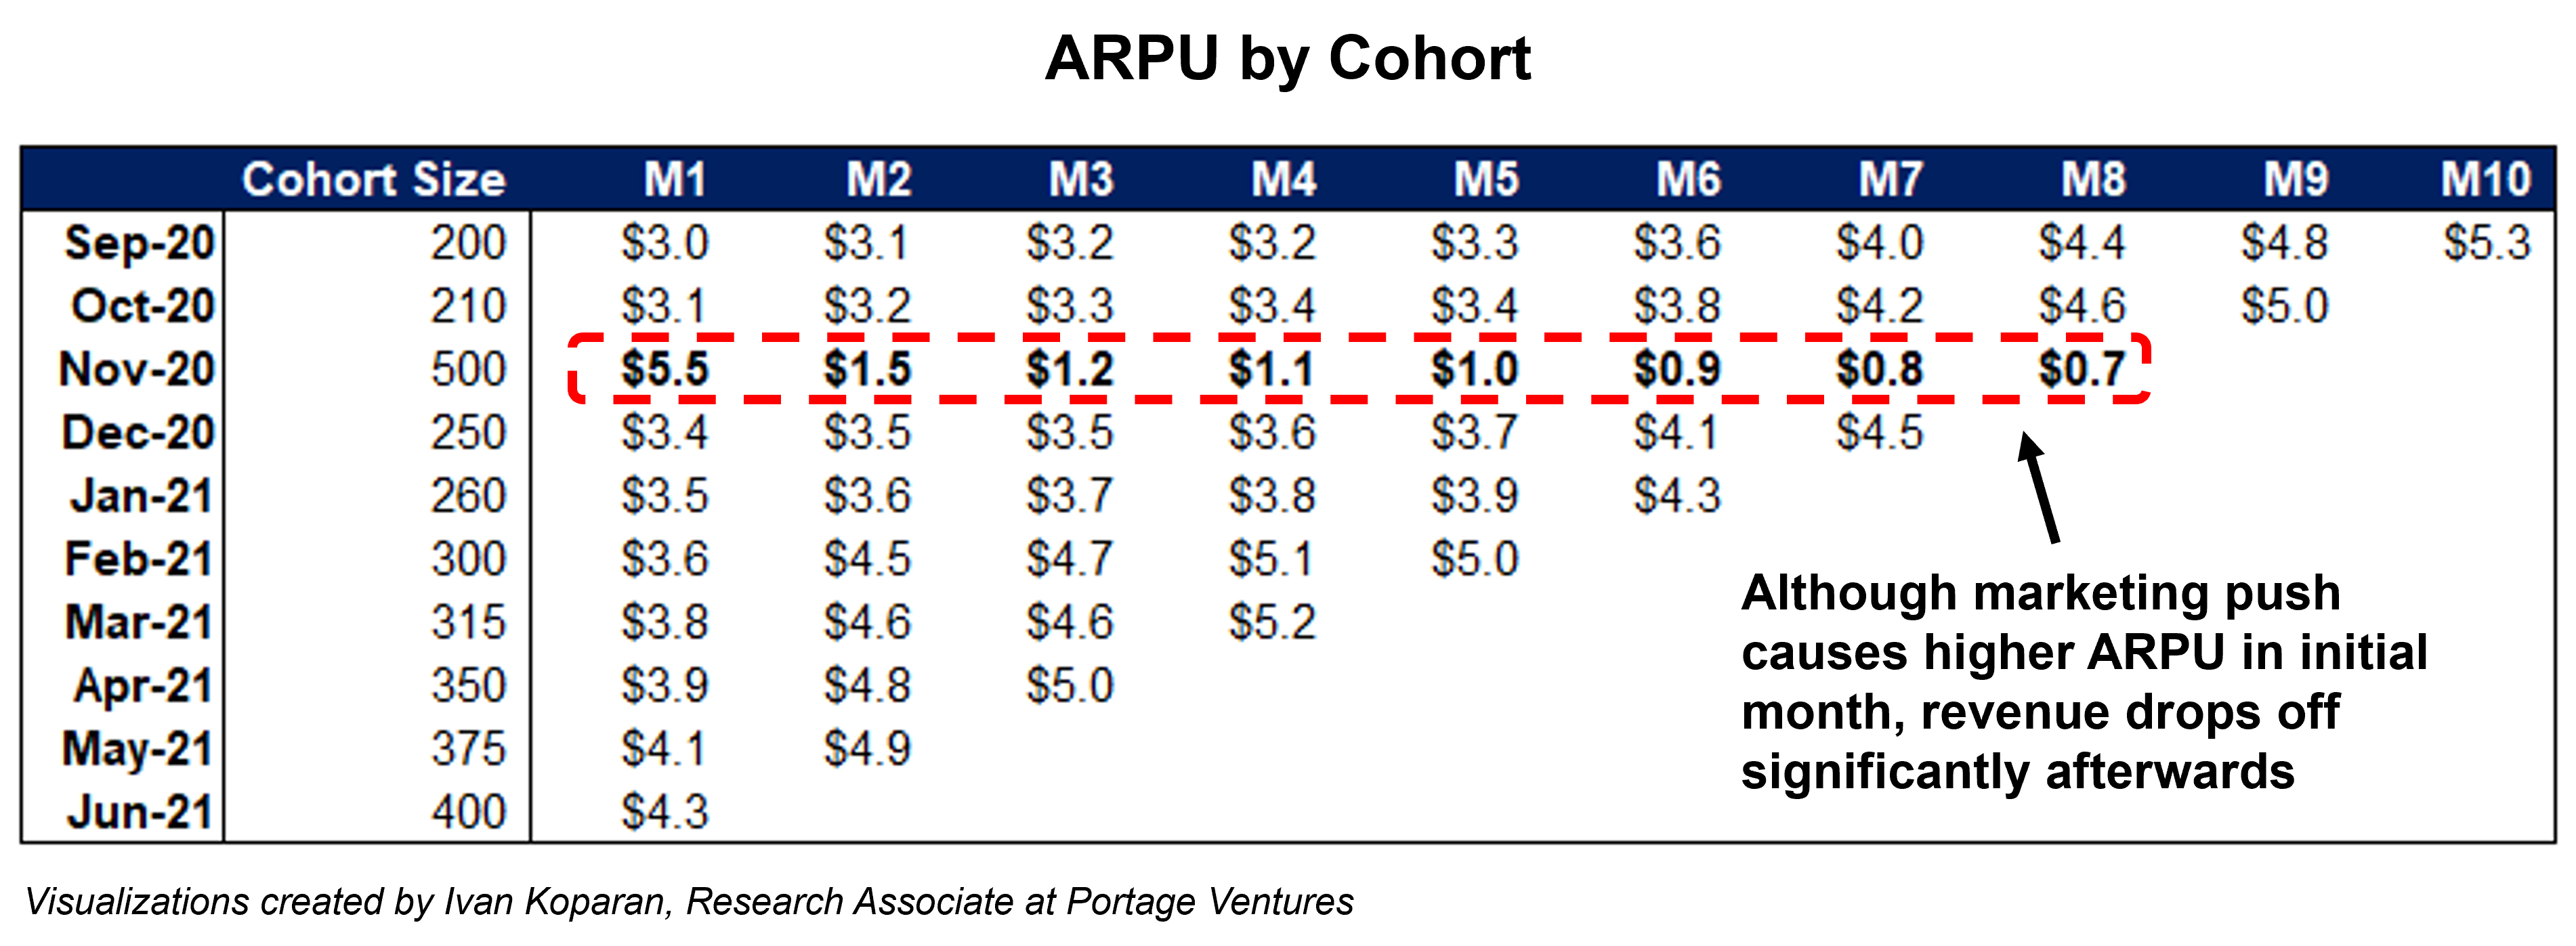
Image Credits: Sagard & Portage Ventures
Above we can see that the November cohort has a strong ARPU pop associated with the Black Friday promotion in (M1, $5.5) versus (M1, $3.1) for regular customers in October. But looking forward, the lifetime value (LTV) of the November cohort drops dramatically with each subsequent month’s ARPU.
In fact, the LTV of the Black Friday cohort is lower than regular cohorts as early as M3, $8.2 ($5.5 + $1.5 + $1.2) versus $9.6 ($3.1 + $3.2 + $3.3) for October customers and substantially lower by M8. It’s now clear that in addition to lower engagement and retention, the Black Friday cohort delivered customers who generate materially less revenue as well.
Smart growth: Paid versus organic customer acquisition
Savvy marketers can go further and leverage cohort analysis to remove biases hidden within averages or blended metrics. One way to do this is segmenting ARPU by paid and organic channels, which allows you to gauge the sustainability of your customer growth.
Let’s take Bluebooth’s ARPU example above and segment the data into customers acquired through paid marketing channels (e.g., Facebook, Groupon) and those we acquired organically (e.g., word-of-mouth referrals).
Recall that the February 2021 cohort size was 300 customers, with an APRU of (M1, $3.6). This reflects customers acquired from both paid and organic channels. Let’s separate them.
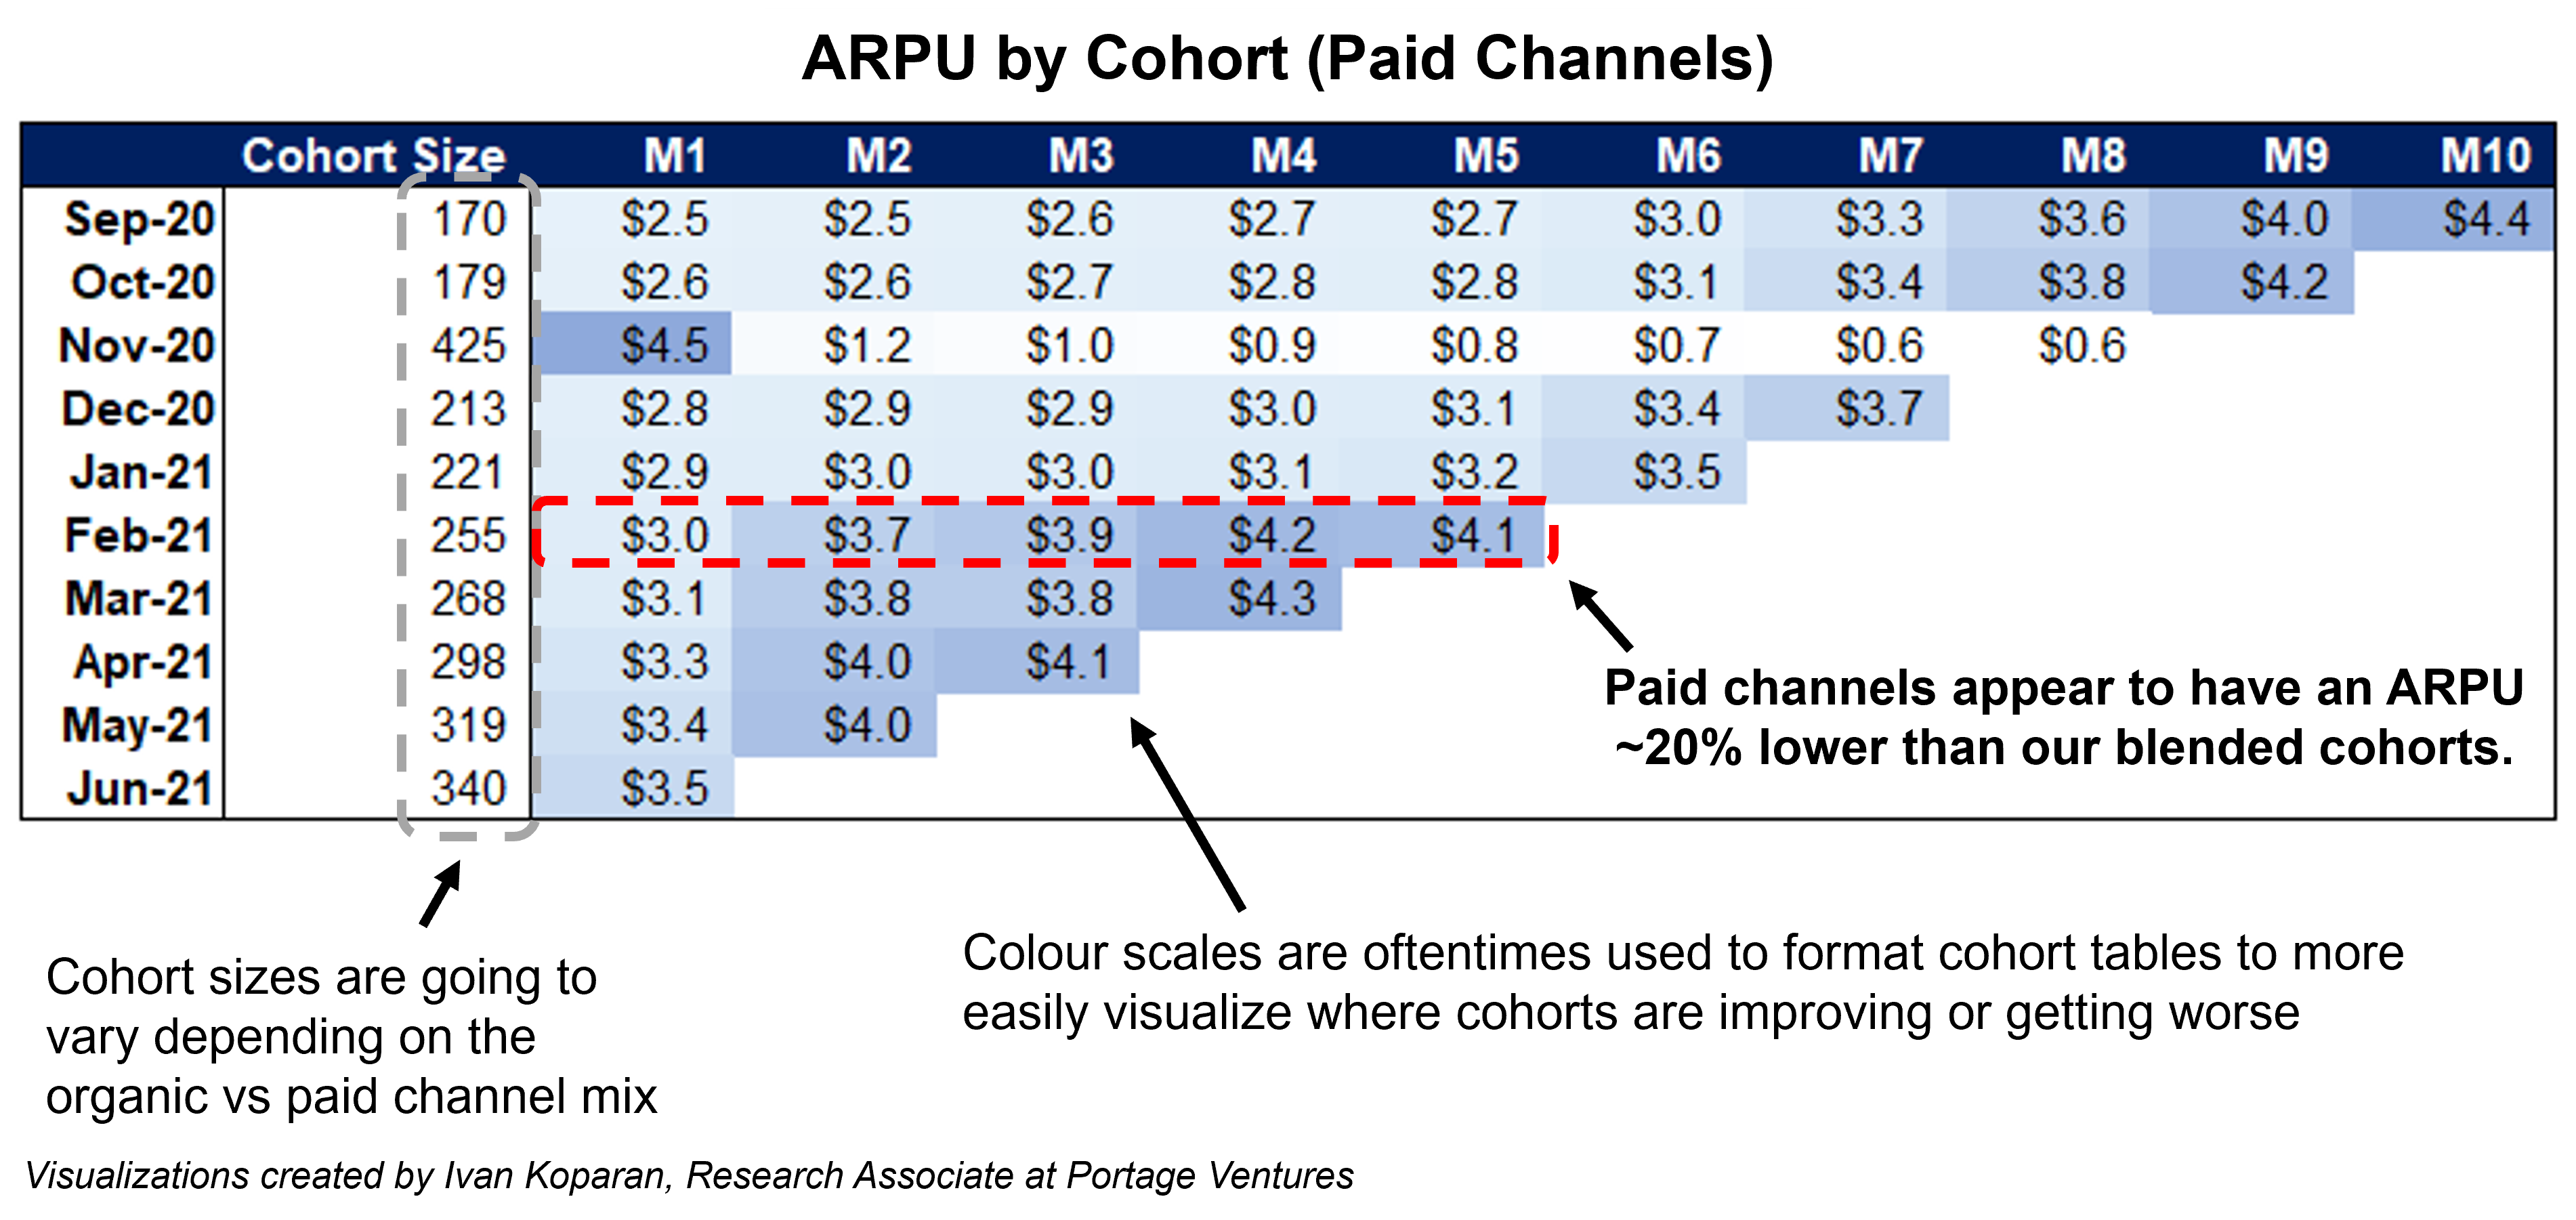
Image Credits: Sagard & Portage Ventures
Above you can see the February cohort included 255 customers acquired through paid channels with an APRU of (M1, $3.0).
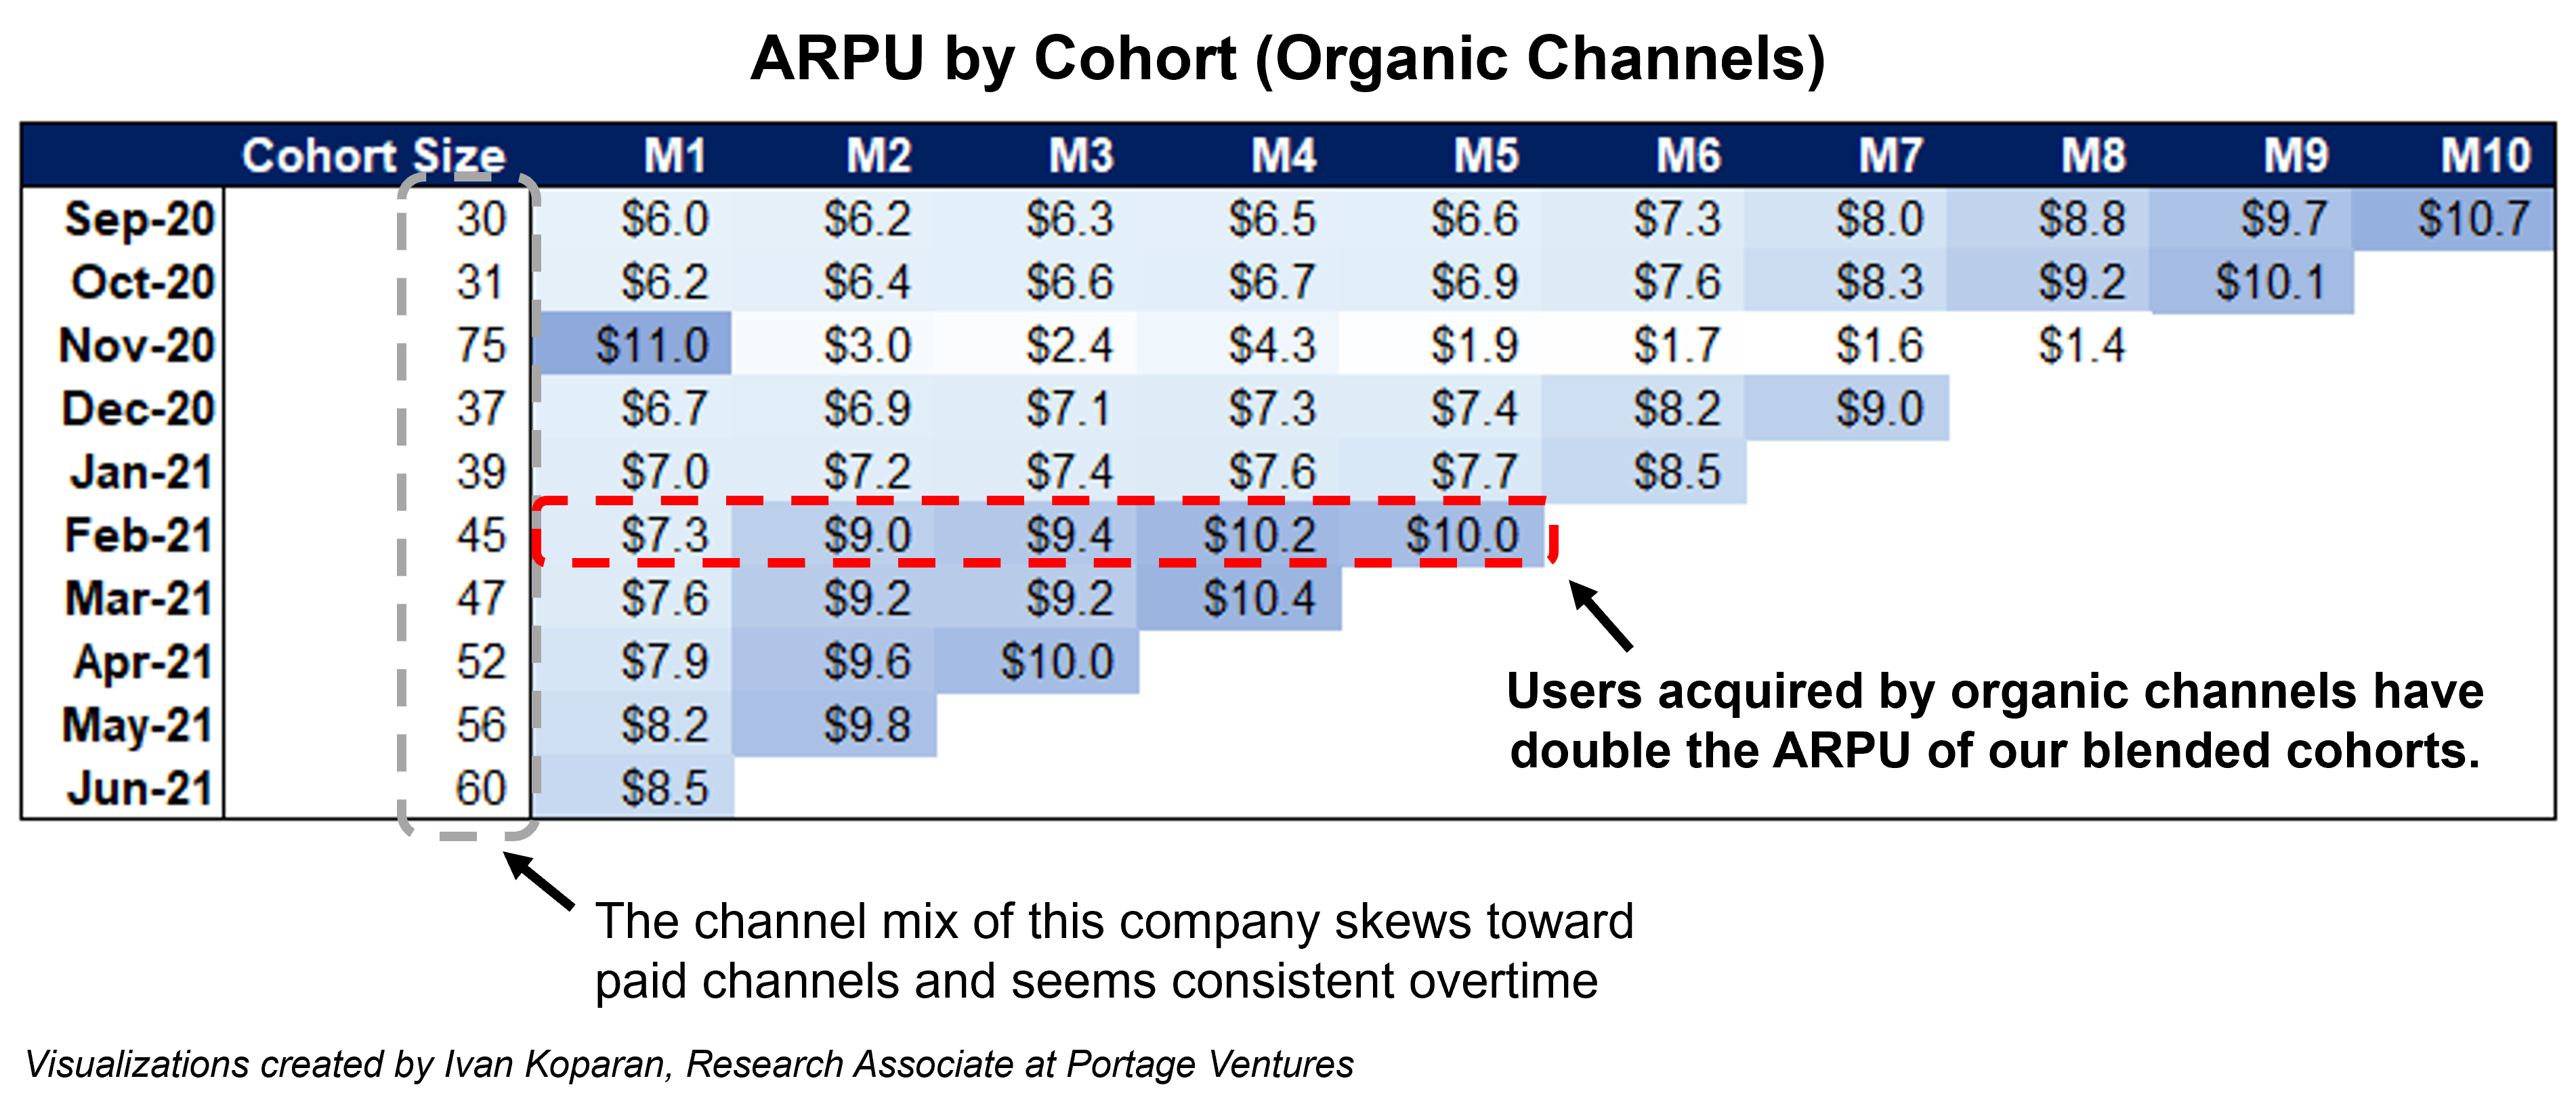
Image Credits: Sagard & Portage Ventures
This cohort also included 45 customers acquired through organic channels with an APRU of (M1, $7.3).
This channel cohort analysis shows us that most of Bluebooth’s customer growth is driven by paid channels (255 out of the 300) and these users generate significantly less revenue (M1, $3.0) compared to those acquired through organic channels (M1, $7.3). Increasing the mix of organically acquired customers would greatly improve the unit economics of Bluetooth.
In conclusion
Cohort analysis is an effective tool to monitor the impact of customer behaviors over time. It showed us that Bluetooth’s Black Friday promotion generated a spike in new customers, but they exhibited higher churn and generated less revenue over time. Additionally, the majority of their customers are acquired through paid marketing channels that yield a lower ARPU and LTV compared to those who sign up organically.
The CMO of Bluetooth Coffee (like all growth marketers) should steer away from future marketing efforts that drive customers with lower ARPU and instead focus on finding more customers that maximize LTV to grow the business.
Every company is different and requires its own set of analysis to properly track the performance of its business. Marketers should proactively partner with their finance teams to leverage cohort analysis to make better marketing investments for smarter growth.