As expected, Southeast Asian superapp Grab is going public via a SPAC.
The combination, which TechCrunch discussed over the weekend, will value Grab on an equity basis at $39.6 billion and will provide around $4.5 billion in cash, $4 billion of which will come in the form of a private investment in public equity, or PIPE. Altimeter Capital is putting up $750 million in the PIPE — fitting, as Grab is merging with one of Altimeter’s SPACs.
Ride-sharing is a profitable business for Grab, though the segment did take a pandemic-induced whacking.
Grab, which provides ride-hailing, payments and food delivery, will trade under the ticker symbol “GRAB” on Nasdaq when the deal closes. The announcement comes a day after Uber told its investors it was seeing recovery in certain transactions, including ride-hailing and delivery.
Uber also told the investing public that it’s still on track to reach adjusted EBITDA profitability in Q4 2021. The American ride-hailing giant did a surprising amount of work clearing brush for the Grab deal. Extra Crunch examined Uber’s ramp toward profitability yesterday.
This morning, let’s talk through several key points from Grab’s SPAC investor deck. We’ll discuss growth, segment profitability, aggregate costs and COVID-19, among other factors. You can read along in the presentation here.
How harshly did COVID-19 impact the business?
The impact on Grab’s operations from COVID-19 resembles what happened to Uber in that the company’s deliveries business had a stellar 2020, while its ride-hailing business did not.
From a high level, Grab’s gross merchandise volume (GMV) was essentially flat from 2019 to 2020, rising from $12.2 billion to $12.5 billion. However, the company did manage to greatly boost its adjusted net revenue over the same period, which rose from $1 billion to $1.6 billion.
Inside of the company’s business units, ups and downs were stark. After deliveries GMV grew from $600 million to $2.9 billion to $5.5 billion from 2018 to 2020; Grab’s rides business GMV grew from $4.6 billion to $5.7 billion in 2018 and 2019, only to tumble to $3.2 billion in 2020.
However, Grab’s overall business was more profitable in 2020 than 2019, seeing its post-combination EBITDA loss narrow from -$2.3 billion in 2019 to -$800 million in 2020.
In short, Grab’s transportation business was hit hard due to COVID, its delivery efforts soared, and the company grew while losing less money.
Which segments are profitable?
Grab has four businesses, of which two — ride-hailing and deliveries — account for the vast majority of its revenues. The company’s financial business generates comparatively modest revenues when stacked against its more established efforts.
Financial services brought in around $200 million in revenue during both 2019 and 2020. However, the segment’s EBITDA losses of $400 million in 2020 mattered. Grab’s deliveries business had a smaller $200 million 2020 EBITDA loss, and its rides business generated $300 million in 2020 EBITDA. (All figures in this section are post-InterCo, taking into account the impact of the transaction, which will eliminate the impacts of “intragroup transactions.”)
Grab’s “Enterprise & Others” segment generates effectively no revenues and has a negligible impact on profitability. It can be ignored.
In short, ride-sharing is a profitable business for Grab, though the segment did take a pandemic-induced whacking; deliveries form a rapidly growing segment at the company that has greatly improved in profitability terms — in 2020, it lost just 25% of its 2019 negative adjusted EBITDA. And Grab’s financial services business is a drag on its bottom line while not helping its top line much.
How close to breakeven is the company as a whole?
Not close at all. Considering its net income, Grab lost $2.7 billion in 2020. That was down from $4 billion in 2019, but up from its 2018 net loss of $2.5 billion.
The caveat is that quite a lot of the company’s recent net losses stem from costs sourced from redeemable convertible preferred stock, or RCPS. That expense, a form of interest, came to $1.1 billion in 2019 and $1.4 billion in 2020. Given that RCPS is, to our understanding, a non-cash cost, how much investors will mind the implied dilution in the company’s net losses and thus be willing to forgive some of their scale, is not clear.
Even discounting 100% of its RCPS expense, the company’s net loss was still greater than $1 billion last year.
What sort of growth does Grab anticipate?
Here’s the chart:
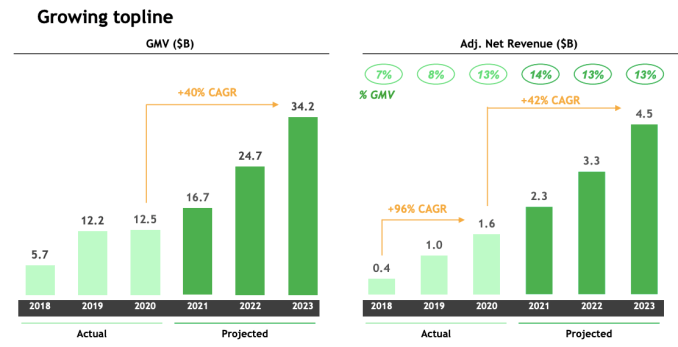
Image Credits: Grab
You can see the COVID-19 impact on Grab’s GMV in the first chart. From here, the company expects total platform spend to grow rapidly. And that results in pretty strong net revenue growth.
Do note that the company does not expect its adjusted net revenue as a percentage of GMV to grow after 2021 — Grab actually anticipates adjusted net revenue to decline to 13% of GMV in 2022 after rising to 14% in 2021.
Still, the company expects a 40% compound annual growth rate (CAGR) in GMV from 2020 to 2023, and a 42% CAGR of adjusted net revenue over the same time period. That’s pretty good given the company’s scale, but a drastic slowdown from its pre-2021 growth pace of 96% CAGR.
What SPAC-ish shenanigans do we need to understand?
Oh boy. Well, let’s start with one of the numbers we just talked about: adjusted net revenue. What is that? Well net revenue is the company’s gross billings minus “Drivers and Merchants Base Incentives” and “Drivers and Merchants Excess Incentives.” Adjusted net revenue adds back in the second category of incentive.
Here’s how Grab defines the bucket:
Adjusted Net Revenue is a non-IFRS financial measure, which adjusts our net revenue by adding back excess incentives. Excess incentives occur when payments made to driver/merchant partners exceed Grab’s revenue received from such driver/merchant partners (excess incentives are calculated on a monthly basis for each country and not on a driver-by-driver basis).
So when Grab overpays someone, it doesn’t want that to count against its revenue. Sure. Cool. Judge that as you will, but reading this Grab deck, it is impossible to not get shades of the same joy that one beholds when trying to parse Uber’s earnings.
Finally, pay attention to the charts that show pre-InterCo data — the company’s performance before it was consolidated — and the tables that adjust for things that won’t stick around post-combination. The charts are often prettier than the tables. The charts, in essence, are what the company told itself before the deal. The tables, like the dataset featured on page 26 of the presentation, undercut some of Grab’s own hype.
Overall, this is a fun deal that will be exciting to see trade.