
While many areas of the economy are set to reopen in the coming weeks — if they’re not already — most startups never actually closed. Tucked away in houses and apartments across the country, founders have been not only focused on running their businesses, but also on securing capital to boost growth once the economy has normalized.
For the most part, the fundraising marketplace has remained open (for a deep dive into VC behavior over the last two months go here). But the last two weeks could be establishing a new normal for fundraising this year that should make founders optimistic. Even though most VCs aren’t taking in-person meetings, and there are still a lot of questions about what our economy will look like in the coming months, VCs are more active this month than they were in May of both 2019 and 2018.
We’re using the 2020 DocSend Startup Index to track three major metrics to show us real-time trends in the fundraising marketplace. Using aggregate and anonymous data pulled from thousands of pitch deck interactions across the DocSend platform, we’re able to track the supply and demand in the marketplace, as well as the quality of pitch deck interactions.
VC interest is at a two-year high
We’re tracking pitch deck interactions across our platform on a weekly basis to compare how VCs are operating today against a backdrop of the last two years. One of the main metrics we look at is pitch deck demand, as measured by the average number of pitch deck interactions for each founder happening on our platform right now.
While VC interest took a dive in March, the last two weeks showed unseasonably high interest. Typically, May signals the beginning of the summer slowdown, which bottoms out around August. However, in the last two weeks, we’ve seen VC interest on average 21% higher than in the previous two years.
While VC interest is high, it’s possible we’re just seeing a displacement of the typical demand we see in the spring, and that the summer dip is still coming. However, the other metrics we’re tracking lead us to believe that we’re going to sustain this growth for at least the rest of May and potentially well into June.
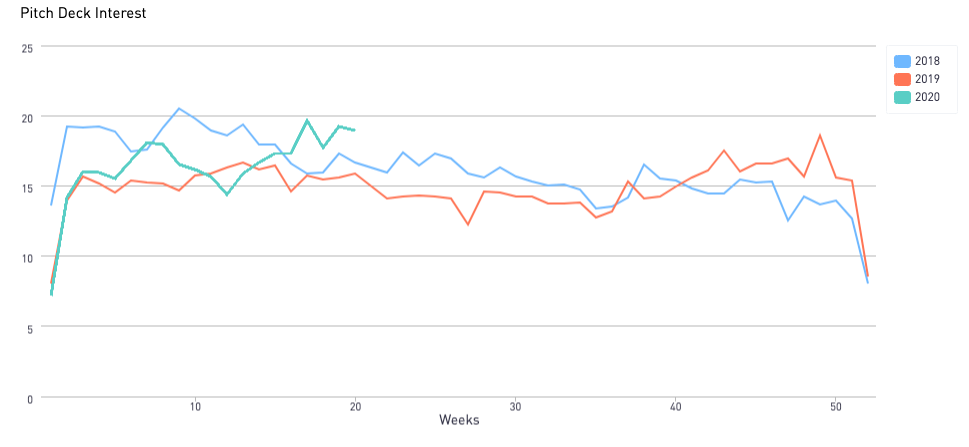
Image Credits: DocSend
Founder supply is keeping up with VC demand
The second metric in the DocSend Startup Index is how many links each founder is creating. Heightened founder activity means lots of decks being sent out, and it can be a leading indicator of VC interest. A spike in links being created by founders should result in investors viewing more decks in the following weeks, as long as the marketplace is functioning like it should.
After a bumpy few weeks, founders have sprung back into action and were once again sending out their decks last week. In fact, last week was the third highest week for founder activity in the last two years. Founder activity reached its peak earlier this year, during the week of January 29th, but that was only a scant 2% higher than last week. Over the last few weeks the number of decks founders have been sending has risen 15%.
While the ideal time for a founder to send out a pitch deck would be when VC interest is high and founder activity is low, with both supply and demand on the rise we could be in for a competitive fundraising marketplace for at least the next few weeks. And because we know VC interest was on the rise in April while founder activity was still low, there’s most likely some unquenched demand in the market that founders still haven’t met.
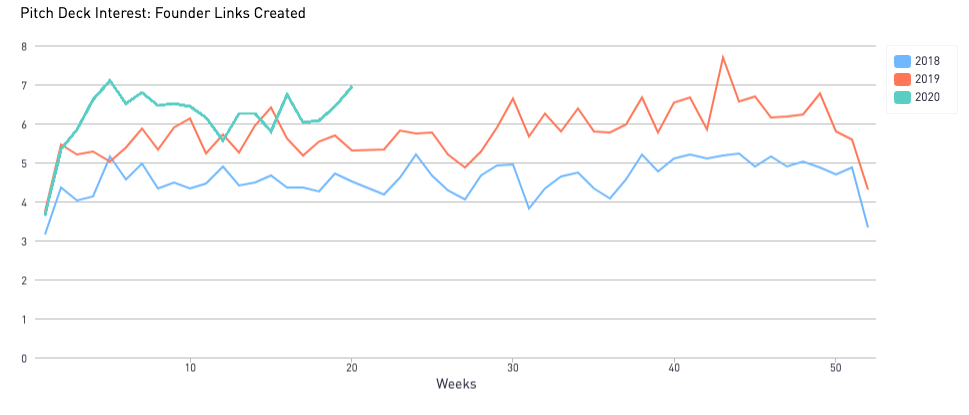
Image Credits: DocSend
How much VC attention is my deck really getting?
The final metric in our index is the average time spent per pitch deck by potential investors. This offers a look at how long VCs are spending reviewing deals, which gives us a proxy for the quality of each interaction. Too little time spent reviewing a deck and an investor likely isn’t absorbing all the information presented; too much and it’s likely to affect the amount of deals they’re reviewing at any given time.
We expect to see some natural fluctuation in this number. In the recent weeks, as we’ve had higher than average supply and demand, we’ve watched as the average time spent reviewing a deal has declined. In fact, we’re at nearly a two-year low. The only other period when time spent dropped below where it is now was in early 2018 (which not coincidentally was also when demand was at its highest). Twice in 2018 we saw time spent go below three minutes and we’re currently at 3 minutes and 7 seconds.
When VCs are racing through decks it means they’re not only looking for a deal, they’re feeling the pressure to find the best deals first (as we can see from 2018). There will most certainly be a whole new breed of unicorns that come out of this crisis, similar to how Airbnb, Uber and Instagram were founded during the 2008 financial crisis. VCs want to be in on that next wave of ideas, and they’re looking through a lot of decks to get there. If you’re sending out your pitch deck right now you need to make sure it’s tight and concise. The best pitch deck is one a VC can peruse at a steady pace, flipping from page to page and absorbing the information they need. Our latest report gives tips and insights on how founders can sharpen their decks (we’ve created a Pitch Deck Analyzer to offer metrics-based feedback as well).
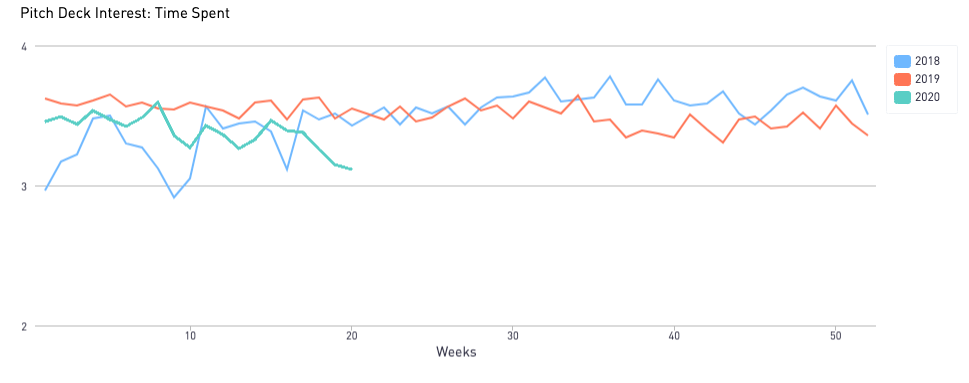
Image Credits: DocSend
Active VCs
While the metrics show an active fundraising marketplace, you’ll want a VC that’s doing more than just window shopping. That’s why we’ve compiled our Active VC List to show not only who’s taking meetings, but who’s writing term sheets. The list currently has more than 290 VCs who are actively looking to make deals, as well as a few who are focusing on their portfolios or looking to write term sheets in the near future. The list divides activity levels into three main areas: focusing on their current portfolios, reviewing deals and offering term sheets. We update the list daily and invite VCs or founders to update the list with any VCs they know are currently active.
Conclusion
Based on the current metrics available, we can predict above-average activity into at least June. Investors are spending less time reviewing each deck while viewing more decks than they were at the beginning of this year. Last week VC interest was only 8% behind its two-year peak in the beginning of 2018.