
Hello and welcome back to our regular morning look at private companies, public markets and the gray space in between.
Today we’re exploring some fascinating data from Silicon Valley Bank markets report for Q1 2020. We’re digging into two charts that deal with the early-stage funding market, and after we unpack what the local Iron Bank of Braavos has to share, we’ll bring in some other data and see if we can back up our conclusions.
To avoid keeping you waiting, it appears that global early-stage deal counts could be slipping. But is this is a real early-stage slowdown?
For founders hoping to get their company out of their minds and into the world, it’s a key question. Without ample early-stage funding, the startup and venture pipeline begins to constrict, eventually limiting late-stage activity after crimping its early-stage sibling.
So let’s dig in and parse out what we can. To the charts!
A global slowdown
To understand the early-stage market itself, let’s start zoomed out, looking at the aggregate venture market over a 10-year timespan. The following chart, used with permission and built using “Pitchbook and SVB” analysis according to the original report, shows both global venture deal count and invested dollar tallies since 2010:
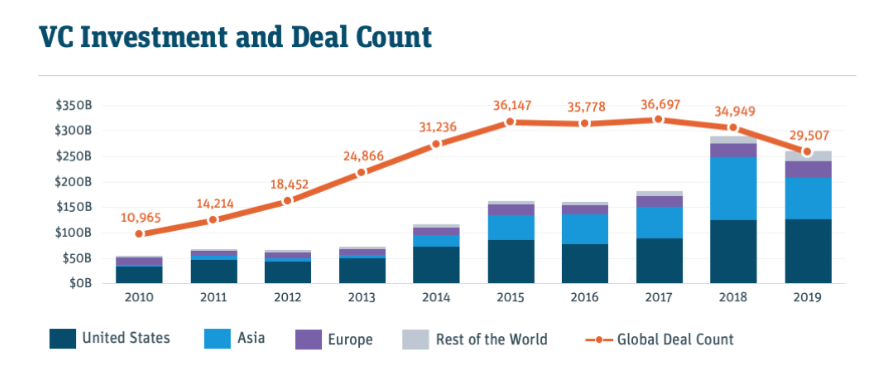
There are about 18 different posts we could pull out of that chart if we had the time, but what we care about is falling global deal volume (the orange-red line) and how it contrasts with the rising global investment totals (dollar volume, shown with bars). More dollars, in other words, even as deal volume slipped in recent years.
In 2014, for example, 31,236 deals led to around $110 billion in invested VC capital. By 2019, fewer total deals (29,507) led to over $250 billion in invested venture dollars. Fewer entries but greater throughput implies larger rounds, good news for the growth- and late-stage markets. After all, larger startups, especially the unicorn mob, love nine-figure checks.
But if round count is going down over time (having peaked between 2015 and 2017, it appears), while dollars invested rise, where does that lead the theoretically myriad, yet small-in-size rounds that make up early-stage VC?
The early-stage dip
Down, it appears, is the answer to our question.
The following chart from the same Silicon Valley Bank report shows how things have shaken up amidst the various venture stages when considered by dollar amount.
Now dollar amount and stage are not perfectly correlated. You can pull together a small yet late-stage round for example. And some early-stage rounds are huge. But there is a correlation between early-stage rounds and smaller deal sizes in dollar terms, just as there is a connection between late-stage rounds and larger investment sums.
All that throat clearing in mind, check out what has happened lately to the smallest investments that the following chart tracks:
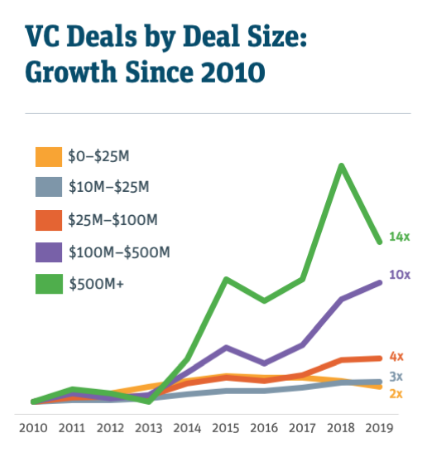
As you can see, the tranche containing the smallest rounds fared the worst. I am not sure if that grouping is supposed to be “$0 to $10M” instead of “$0 to $25M,” but it works either way for our purposes. The line that includes the smallest, and therefore the earliest-stage rounds, did the worst in terms of volume growth.
In fact, there is no sequential improvement as we go through the size bands. The second smallest (the grey line) did better than its smaller sibling, bested by its numerical superior (the red line), which was in turn beaten by the next largest (the purple entry). All were beaten in percentage gain terms by the largest cohort (rounds of $500 million or more).
So the smallest set of rounds post the least growth, and if you peer closely, you’ll note that the earliest-stage rounds are also the only line that is decreasing.
What do others say?
All that points to an early-stage slowdown, frankly.
In contrast, the latest venture projections from my former publication, Crunchbase News, paints a different picture. Indeed, that publication’s Q4 2020 report included a dataset that makes early-stage look pretty OK. Here are the key bits:
Crunchbase projects a total of 9,892 early-stage deals were struck in 2019, worldwide. That’s down slightly, nearly 4.6 percent, from 2018’s projected high of 10,367 rounds.
Crunchbase News went on to report that the North American share of early-stage deals came to just over 40 percent of global totals in Q4 2019, down from 46 percent in the year-ago period. It’s worth noting that Crunchbase News breaks out Angel and Seed rounds separately from early-stage. Our prior data would include such rounds. But as Crunchbase News crew had even more positive data on Angel and Seed deal volume than early-stage, the distinction only heightens the contrast.
The Crunchbase team is working with projected data, mind, which is slightly different substance. All the same, our early-stage slowdown point is no slam dunk.
But directionally, calling a slowdown in early-stage activity feels correct. Few early-stage VCs will ever admit to slowing their investing cadence. It shows a lack of confidence in a market that thrives and lives off of conviction. But from my own poking through the data, I reckon the earlier stages of the venture market are softer than the later tranches.
There are pockets of frenetic activity, of course. But those are the exception and not the rule. And now with at least one data source flashing a warning sign, we have something to keep an eye on when we get more data as Q1 races towards the halfway mark.
As always, write in with your own thoughts.