
It’s been just over a year since Google announced its $300 million News Initiative, which included funding for independent journalism efforts along with products developed by Google.
One of those products was News Consumer Insights, which has been used by publishers like BuzzFeed, Business Insider and Conde Nast. It takes data already collected through Google Analytics and makes it more useful for publishers, particularly when it comes to understanding different audience segments and whether they’re likely to become paying subscribers.
“It’s turning raw data into business intelligence and actionable insights,” said Amy Adams Harding, Google’s head of analytics and revenue optimization and head of publisher development.
Now Google is building on the NCI product with a new tool called Real-time Content Insights.
As the name implies, RCI is focused on telling publishers what’s happening on their site at this moment, and on helping them identify trending news stories that could attract more readers. The initial NCI data is more useful for the publisher’s business or audience development teams, Harding said. RCI is designed “to help the editorial side of our partners understand the dynamics of content on their site — what’s trending, what’s falling off, what’s getting traction.”
Real-time Content Insights
Google is hardly the first company to offer real-time data to news publishers, but Harding said this “off-the-shelf, click-to-play” product could be particularly useful for smaller newsrooms that don’t have a lot of resources and aren’t particularly data-savvy.
“Local is a huge pillar of the Google News Initiative,” Harding said. “What can we do to help develop tools where we can be support mechanisms for our partners as they try to stay sustainable during this transition … not only to digital, but one more transition over to this diversified revenue stream? That’s something that many of our publishers are not resourced well enough to take on on their own.”
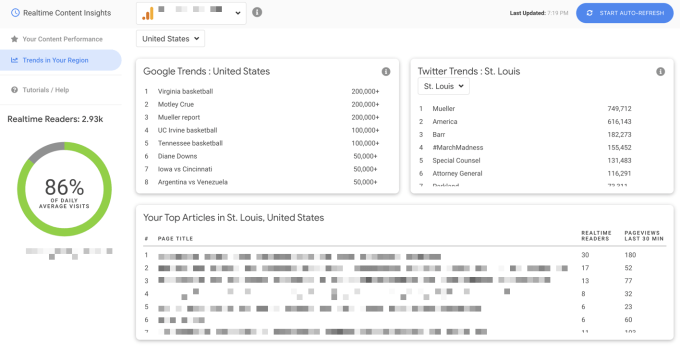
RCI presents the data in the form of an image-heavy dashboard showing how many readers are looking at a story currently, and how many views the story’s gotten in the past 30 minutes. You also can see how well the site is doing today, compared to a normal day’s traffic, and break down your traffic by geography and referral sources.
The dashboard also shows the topics that are currently trending on Google and Twitter. Of course, not all of those topics will be right for your publication, but Harding said it can help editors and writers identify the gaps in their coverage, based on, “What are people curious about?” (on Google) and “What are people talking about?” (on Twitter).
At first glance, RCI doesn’t seem to tie directly into the bigger goals of helping publishers building sustainable, diversified business models. However, Harding noted that it can be used in conjunction with the existing NCI product, which helps them identify their most valuable audiences.
“Where the publisher would see value is, ‘Okay, we know that users coming from direct referral traffic are more valuable, [and] this article is driving is driving viewership from those types of readers,’ ” she said.
Harding added that Google is making the RCI source code available on GitHub, so that more-sophisticated publishers can customize it to create their own data visualizations.