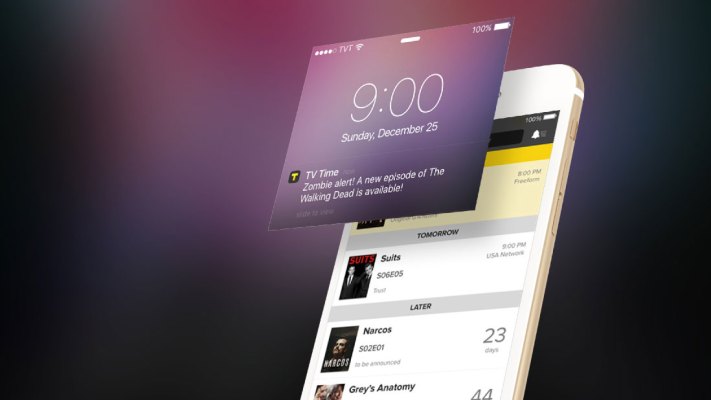
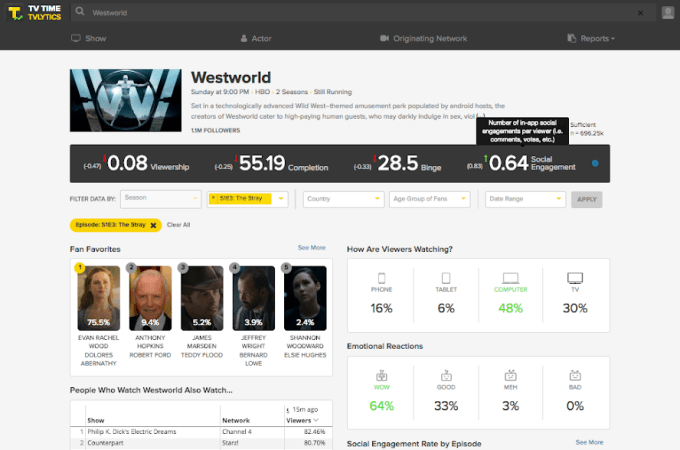
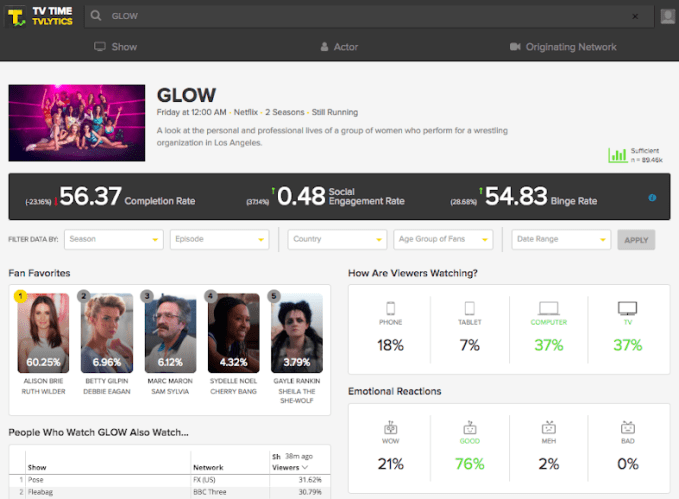
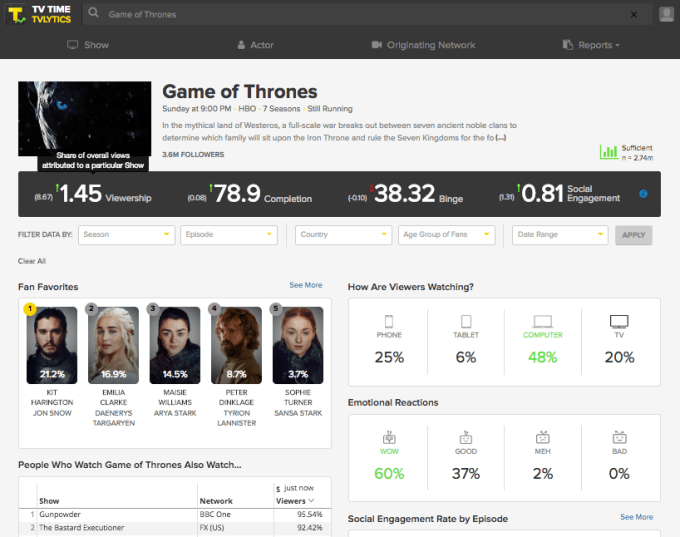
TV Time, the consumer app that helps bingers keep track of where they are with favorite shows and socialize with fellow viewers, is today expanding its business with the launch of an analytics platform called TVLytics. The new service will allow creators and distributors to tap into real-time data from across more than 60,000 TV shows. It will also offer other anonymized data collected from viewers, including things like on which platforms viewers watched, their favorite characters, bingeing behavior, viewers’ locations, anticipation from fans for new episodes, social engagement and more.
The data is pulled from the app’s community of around a million daily users from more than 200 countries who check in with the app some 45 million times per month. To date, TV Time has tracked more than 10 billion TV episodes, and has seen 210 million reactions.
TV Time began its life as a source for TV show GIFs known as WhipClip, but later pivoted to a social TV community after acquiring TVShow Time in December 2016. This proved to be a smart move on its part, as the company has grown to 12 million registered users (and growing).
The app’s core functionality is focused on offering TV viewers a place where they can follow shows and mark off the ones they’ve watched — something that’s especially helpful in the streaming era where people are often hopping from one binge-watching session to another, then back again, or are watching multiple series at once and need to remember where they left off.

In addition to being a utility for tracking shows, the app offers a community section for each episode where fans can post photos, videos, GIFs and memes, as well as like and comment on the content others share. Viewers can even leave video reactions about each episode, in a format similar to the “Stories” found on apps like Instagram or Snapchat.
TV Time also interjects questions of its own — asking about your reaction (good, funny, wow, sad, etc.), favorite character, device watched on and more. And it inserts its own polls in the middle of the fan discussion page, which ask about pivotal moments from the episode and what people thought.
With the launch of analytics, TV Time aims to make use of all this data by offering it to clients in the TV industry who are looking for more comprehensive viewership data for planning purposes.
Of course, TV Time’s data is not a Nielsen equivalent — it’s user-generated and self-reported. That means it’s not going to be able to tell content creators, networks, distributors and other clients how many people are watching a show exactly. Nor can it give a holistic overview of the show’s fan base. TV Time’s viewers skew younger — in the 18 to 34-year-old range — and only around 10 to 15 percent are based in the U.S., though that market is the fastest growing.
But TV Time can tap into the reactions and sentiments shared by a subset of a show’s most engaged fans.
Its paying clients today include a handful of TV networks, streaming services and talent agencies that have been testing the app in beta for around a month. They use TV Time’s analytics to help spot trends, develop and expand a show’s audience and make decisions about how to cast and market their shows. Some have also used it in advertising negotiations. Customers pay a flat annual subscription fee for access to this data, but TV Time won’t disclose exact pricing.
“We’ve been testing it to figure out which of the insights we’ve launched are most valuable. That’s how we landed on things like the completion rate, the binge rate, affinity reports, mobility scores and favorite characters,” explains TV Time head of Programming, Jeremy Reed.
The value offered by TVLytics data doesn’t just come from the data itself, but also how hard it is to collect. In today’s fragmented TV viewing ecosystem, consumers now watch across devices, and split their time between live TV, recorded TV, live TV delivered over the internet, subscription video services and internet video sites, like YouTube.
In addition, TV Time notes that, overall, the number of long-form shows on television has grown by 69 percent since 2012, with nearly 500 scripted original series airing in 2017, citing data from FX Research Networks. The majority of these scripted shows are coming from over-the-top platforms such as Netflix, Amazon and others. That’s a lot of TV content to keep up with, especially as consumers hop between devices — even in the midst of a single episode.
What TV Time does is keep all this viewing data together in a single destination, and can make connections about what viewers are watching across platforms — from TV to Netflix and beyond.
“With studios — they’re looking two years out in producing content. They start to see trends in types of characters, and certainly start to see the characters of this show resonate with the characters of this other show and start to see the overlap,” notes Reed. Plus, he adds, that overlap is “agnostic to platform.”
TV Time data is put to use for consumers as well, in terms of helping to recommend their next binge.
And now its community is demanding the ability to track movies, too — especially now that streaming services are backing their own feature films. Reed says this isn’t something TV Time has planned for the near-term, as there’s so much to do around episodic content — but that it’s absolutely “a never-say-never” kind of thing, he hints.
Santa Monica-based TV Time’s team of 35 is backed by $60+ million in funding, according to Crunchbase, from investors including Eminence Capital, WME, IVP, Raine Ventures and Greycroft, plus individual entertainment and media industry executives like Ari Emanuel, Peter Guber, Steve Bornstein, Scooter Braun, Gordon Crawford and Ron Zuckerman.