Games, dating apps and streaming services contributed to a rise in consumer spending in iPhone apps last year, according to new data from app store intelligence firm, Sensor Tower. The firm found that U.S. iPhone users spent 23 percent more on in-app purchases in 2017 than they did the year prior – or, an average of $58 per active user was spent on in-app purchases, up from $47 in 2016.
To be clear, this is only on purchases made within an app using Apple’s in-app purchase or subscription mechanisms. It’s not tracking e-commerce purchases – like things users bought in Amazon – or payments made to service providers in an app like Uber or Lyft.
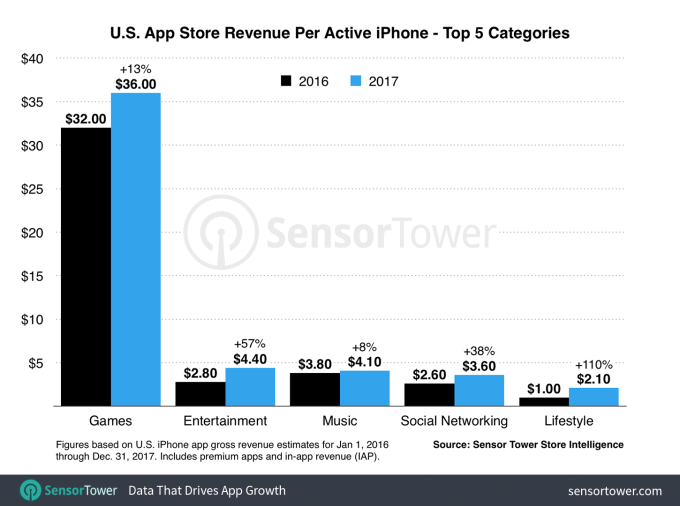
Games were the largest category of consumers spending in 2017, accounting for roughly $36 of the $58 spent per device; or 62 percent of the spending. That’s a 13 percent increase over 2016’s $32 spent.
It’s no surprise that the biggest driver of iPhone spending is games.
The category typically outweighs all others in terms of revenue, not only for paid downloads, but for the ongoing purchases of things like virtual goods, unlocking levels, in-app currency, and the other extra features that mobile games offer. And because people play some types of games for long periods of time – like MMORPGs – they have many opportunities to spend on in-game items.
So while it’s notable that in-app spending in games is up by a few dollars, year-over-year, the more interesting trend is the rise in in-app spending generated by Lifestyle apps and subscription-based streaming services.
Specifically, outside of games, Entertainment apps – which includes streaming services like Netflix, Hulu, HBO NOW, etc. – grew 57 percent year-over-year to reach $4.40 in consumer spending per device. That makes it the largest category of spending outside games.
Music is also another big category for spending, up 8 percent year-over-year to $4.10. Much of what people are paying for in a music app is a subscription for the premium tier of the service, as with Pandora or Spotify. If this category was combined with Entertainment – which is also growing thanks to subscriptions – you’d see that streaming services are now a big factor contributing to the overall rise in U.S. consumer spending in iPhone apps.
But subscriptions to other types of services are growing, too.
Lifestyle apps, led by dating apps like Tinder and Bumble, grew 110 percent from 2016 to 2017 to reach $2.10 in iPhone consumer spending per device.
Spending in social media apps was up by 38 percent, to $3.60 thanks to things like in-app tipping (e.g. Live.me, Periscope, YouTube Gaming), subscriptions (e.g. LinkedIn memberships), and other activity (e.g. call credits in Skype).
Twitch has oddly categorized itself as a “Photo & Video” app, in case you’re wondering where it fits in.
While Sensor Tower’s published report focused on iPhone consumer spending, the company tells TechCrunch that Android spending on Google Play was much lower last year.
“We estimate that for each active Android device in the U.S. last year, approximately $38 was spent on Google Play – on and in apps – so about $20 less than iOS,” said Sensor Tower’s head of mobile insights, Randy Nelson. “That tracks with the disparity in revenue generation we see between the stores outside the per-device level,” he added. “Android users generally spend less on or in apps, Google Play generated about 60 percent of the App Store’s revenue last year in the U.S.”
However, he pointed that Android users have more than one official store to buy from – like the Amazon Appstore or Samsung Store, for example. Some apps also choose not to monetize directly through Google Play, which is an option not permitted on Apple’s App Store.
The increase in consumer spending isn’t the only significant trend Sensor Tower spotted.
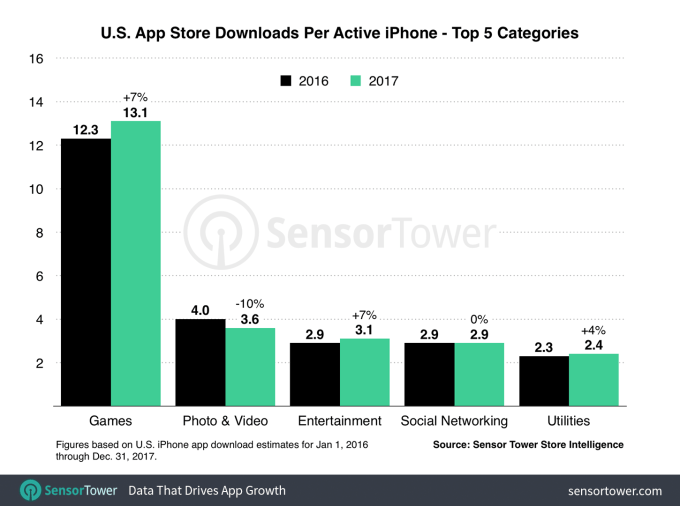
iPhone app installs in the U.S. were up nearly 10 percent from 2016 to 2017, with users installing an average of 4 more apps in 2017 compared with the prior year.
Games, again, were a big source for installs, followed by Photo & Video apps, Entertainment apps, Social Networking and Utilities.
In total, users had installed an average of 45 apps on their iPhone apps in 2017, the firm found.
Correction, 4/13/17, 1 PM ET: users have installed 45 apps over the past year; that’s not the number of installed app; the post has been updated with clarified wording. Apologies for the confusion.