
Looking at the number of exits produced and the total dollar volume those liquidity events commanded, the European startup scene has shown growth over the past year.
That fact comes from the Startups M&A 2017 Report — made in partnership with Crunchbase and Mind the Bridge. The report details the growth and maturation of the global startup scene, with a particular focus on the European continent and its most recent exit results.
This is the second time Crunchbase and Mind the Bridge have worked together to dive into the world of European startups. Last year the data, as noted on TechCrunch at the time, indicated that in the last half decade “U.S. companies have purchased about four times as many startups as European acquirers.”
So how much has changed since the last report?
M&A
The number of global startup exits from 2011 to 2017 has shown rapid growth, especially since 2014, a year that could be fairly tagged as one of the peaks in the unicorn cycle. According to the report, the 12-month period ending July, 2017 saw 4,217 startup exits, up from 2,976 in the preceding period.
However, that growth was not mirrored in the value of those exits. Of course, we are dealing with partial exit numbers, as many liquidity events are never price-disclosed. Regardless of that caveat, the following chart was eye-catching:
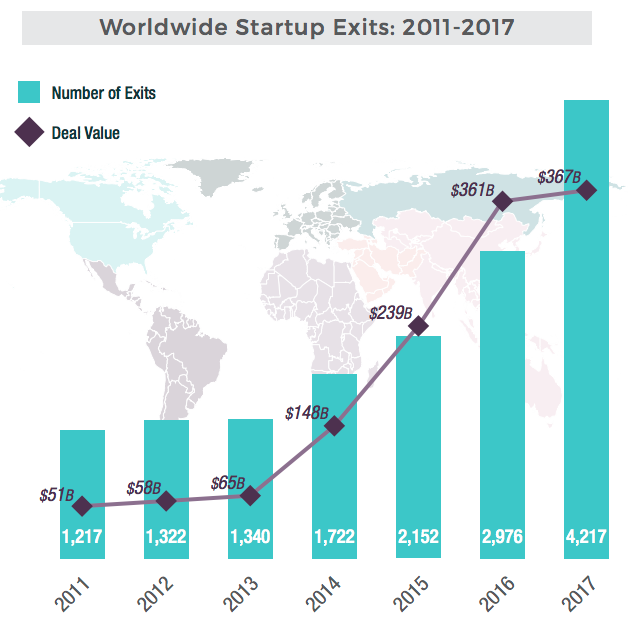
(Date range: July 2010 to June 2017. From the document: “Annual data refers to the period July (previous)-June (listed).”)
Even though total deal volume increased, there are three possibilities that spring to mind concerning the deceleration in exit dollar worth of those startups:
- More startup exits happened without their prices becoming known.
- The average acquisition price went through a reduction.
- Perhaps a little of both.
Regardless, the 2017 period as listed above set new records. This implies, with caveats, that the environment is still quite good for startups looking to tap out, trade in or join up.
What about Europe?
Writing from Silicon Valley, it’s easy to forget that other parts of California exist. But in addition to the rest of California, it turns out whole other continents feature startup activity.
For instance, it isn’t hard to find enthusiasm about Latin America. And we can even find a little bit too much exuberance in certain sectors of the Chinese startup world. Now let’s narrow the sight on Europe, as the report has several data points concerning the continent that are worth our time.
First, cutting down from the above chart here are the exit numbers, broken down by geographic region:
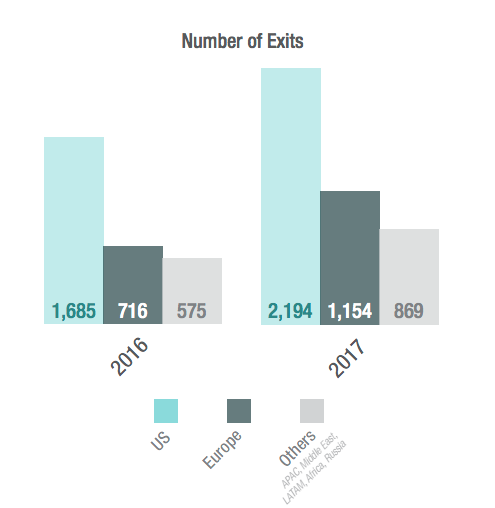
In the listed 2016 period, European exits accounted for just 42.5 percent of the U.S. total. In the 2017 period, that number had risen to 52.6 percent. Of course, the raw number of U.S. exits grew dramatically over the same period. So what’s the implication? In short, the European scene, despite growth in the U.S. market, managed to grab more relative exit share.
That’s pretty bullish. Now here are the same charts tracking known exit value:
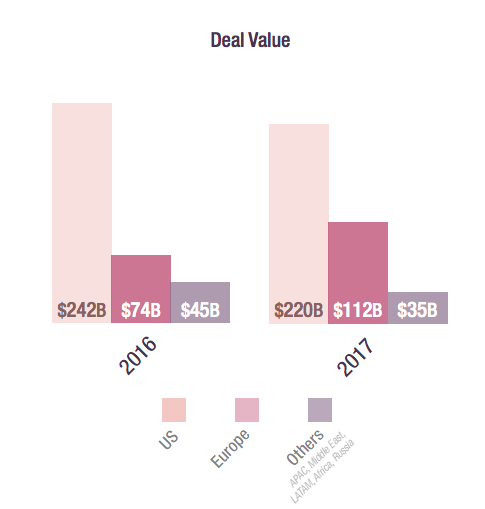
Running the same numbers, here’s what we can say: In the 2016 period, European startup exits were worth just 30.6 percent of their U.S. counterparts. In the 2017-period, that number grew to 50.9 percent.
However, as the value of U.S. startup exits fell, we could be seeing the specter of undisclosed exit values coming to roost. How likely it is that the aggregate (know and unknown) dollar value was down in the U.S. compared to the year before is up to you to determine.
Regardless, the value of European startup exits went up as its deal volume rose.
Relative performance
Notable in the report is cross-border startup M&A between the U.S. and Europe. Given the strong trade ties between the two areas, it’s perhaps not surprising that there is quite a lot of cross-Atlantic startup deal making.
Here are three key data points:
- “In 87% of US acquisitions both sides were domestic companies, while this number is 75% for European M&A deals.”
- “US startups accounted about 25% of acquisitions by EU companies, but ate up 58% of the total capital. This would suggest that US startups are more expensive than European counterparts.”
- “US companies were responsible for more than a third (36%) of European startup acquisitions.”
Summing the three, both the U.S. and Europe largely conduct M&A deals inside their own borders, which isn’t shocking. Geographical proximity counts for a lot, even in our digital age, given the wildly varying local laws concerning IP, taxes and more. But that fact doesn’t stop the continents from buying from each other. In fact, of the companies that European startups buy, a quarter were from the U.S. They were purchased at high cost, it seems, as evinced by the 58 percent number. And on the other end of the ledger, U.S.-based companies were responsible for more than a third of European startup acquisitions.
That all points to a robust cross-Atlantic startup M&A market. What will become of it when a nearly inevitable correction occurs remains to be seen. For now, times are good.