In our series A Look Back In IPO, we’re diving back into the S-1 documents of tech’s biggest players. What were today’s giants like back when they first filed to go public? After looking into Amazon, Microsoft and Google, we’re peeking at Facebook.
Living in the post-Snap IPO era as we now are, it’s a great moment to look back at Facebook’s public offerings. After all, Snap is a key Facebook competitor and a prior acquisition-target for Big Zuck.
But it wasn’t that many years ago that Facebook was the Snap of its day: The social property of note, with questions regarding its financial future at least partially unanswered. So let’s rewind the clock and take a look at Facebook’s IPO.
2012
Facebook’s first S-1 is dated February 1st, 2012. Its final S-1/A was filed May 16th of the same year. The firm went public two days later on the 18th.
In the end, Facebook settled on a $38 per-share price after a positive pricing cycle. As Forbes noted on May 17th, 2012, the company both raised its price above range and threw in more shares:
Facebook priced at the top of its $34 to $38 per share range, showing the strong investor demand for the stock. This week Facebook raised the price range of the offering from a range of $28 to $35. Then the company increased the size of the offering from selling shareholders. The Menlo Park, Calif. company is selling 421 million shares, 180 million from the company and 241 million from selling stockholders.
You can quickly do the math yourself: $38 per share times 421 million shares works out to a smidge under $16 billion — an incredible IPO sum. However, the firm only collected a portion of that total, as the final clause in our quote notes. The company’s 180 million shares worked out to a smaller $6.8 billion sum.
Still, the aggregate value of shares sold in its IPO was staggering, as was the valuation Facebook settled on: $104 billion. Media coverage wasn’t kind at the time to the figure, despite investors being willing to buy the company’s shares at the price.
The Verge, for example, dished the following: “Can Facebook live up to its $104 billion valuation?” The article also featured the following URL slug: “facebook-ipo-peaked-overpriced-stock.” That’s plain enough.
Around the same time, TechCrunch, noting that Facebook’s IPO was the “third largest IPO in U.S. history,” argued that the social company’s rich valuation implied that the firm would “likely need to add bold new revenue streams to justify the mammoth valuation.”
How fair was that skepticism? Let’s find out by looking at Facebook’s then-current financial performance.
The financials
For our work today, we will employ Facebook’s final S-1/A document. It includes the company’s Q1 2012 results that were unfinished in its earlier filings.
What is immediately remarkable about Facebook is that, unlike nearly every technology company pursuing an IPO today, it sported both revenue growth and rising profits. (So far, only one of the four companies in the Big 5 that we have examined was a money-loser at the time of its IPO. And the exception is Amazon, which remains an exception to this day.)
In fact, observe the following chart showing Facebook’s remarkable trailing quarterly results:
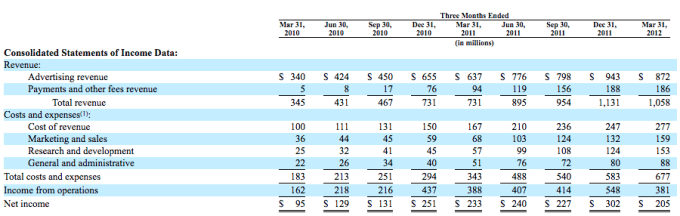
(Drilling a bit further, Facebook had very little share-based expense in the then-year-ago first quarter [2011]. Deduct that cost from the company’s 2012 first quarter and its profit rose, in case you noticed the year-over-year profit results and found them wanting.)
Regardless, Facebook was going public with a history of revenue growth, GAAP (meaning inclusive of all annoying costs) profits and its first seasonal decline in revenue that we can see.
Dialing back a bit, from 2010’s fourth quarter to its first quarter in 2011, Facebook’s revenue stayed flat, implying that it managed to meet its holiday-bolstered quarter in the following period through sheer growth. From 2011’s holiday cycle to 2012’s opening three months, Facebook shrunk.
We care about Facebook’s first seasonal slip as Snap, our modern comp of sorts for Facebook’s IPO days, saw seasonal declines in its revenue far earlier in its growth curve. Snap is barely over the $150 million-per-quarter revenue milestone and saw seasonality-induced revenue declines in its first quarter. Facebook was multiples larger before it had the same issue; how bullish that was for Facebook, or how bearish today’s situation should be for Snap, is up to you.
Returning to our question of how fair media skepticism was for Facebook’s IPO, let’s again read The Verge and TechCrunch. First, The Verge, from its Facebook IPO coverage:
When you compare Facebook to other public tech companies, its valuation also looks way out of whack. The company earned around $1 billion last year, which means its price to earnings ratio, a common method for evaluating stocks, is roughly 100 to 1. Google currently trades around 20 to 1 and Apple, far and away the most profitable tech company of our times, is trading around 16 to 1.
And TechCrunch made the same point: “A $104 billion market capitalization puts Facebook at more than 100 times its trailing earnings.”
In short, both publications harped on Facebook for being expensive on a price-earnings basis when compared to its already public rivals. This is notable for a couple of reasons when we stack 2012 against the current market:
- Facebook was judged as not profitable enough, growth aside. Snap, in an imperfect but directionally useful comparison, was judged at IPO only on growth-staggering losses, and recent gross-margin-negative performance be damned.
- It was thought to be reasonable not only to demand that tech companies be profitable at IPO, but that they should, perhaps, stack up (at least somewhat) next to far more mature public companies in terms of profit metrics.
The market was therefore very different in 2012 than it is today — something I think that we forget. Reading through coverage of Facebook’s IPO, it’s obvious that Snap would not have been able to go public in 2012. The market would not have tolerated something so unprofitable to sport a sky-high valuation so close to the 2008 recession. There simply wasn’t the same appetite for risk.
So Facebook had to go public under stricter rules. That isn’t some sort of punishment, per se, but that market condition as at the time did Facebook in the ass eventually: Despite putting up $1 billion in trailing profit, Facebook was in for a rough ride after its shares started to trade.
The aftermath
Returning to our chewing of contemporary media reports, here’s TechCrunch’s coverage of Facebook’s results just over 10 days following its IPO: “Facebook Has Lost About $35 Billion In Value Since IPO As Shares Dip Below $29.”
The company went public at $38, as you recall. The company’s ensuing share-price declines led to a dramatic spurt of negative coverage of the company. Headlines like “Embittered Facebook investors ponder next move” came out as Facebook’s share price continued to fall.
Facebook didn’t stop deflating until it slipped under the $18 per-share mark. It was a staggering reversal of trend. Recall that Facebook raised its IPO price range before pricing at the very upper-end. The fall from $38 to $18, for example, is just over 50 percent.
Of course, the time in purgatory didn’t last forever. In mid-2013, Facebook shares perked up following its second-quarter earnings results and never looked back, at least as of the time of writing.
What went wrong for Facebook and what eventually went right for the company have the same answer: mobile; if Facebook was going to manage a switch to the mobile world was, for some time, an open question. Investors were worried, and fear leads to a lower share price.
And so when Facebook answered the mobile question, that same fear was mitigated. And its share price recovered. Before we go, let’s remind ourselves of what happened in that critical 2013 spring quarter.
Coda: Mobile victory leads to corporate (value) salvation
If you will allow the self-quote from my coverage of Facebook’s Q2 2012 earnings for TechCrunch:
Mobile income as a percentage of ad revenue totaled 41 percent, up 11 percent from the preceding quarter, when it totaled 30 percent. In the final quarter of 2012, mobile ad income was but 24 percent of the total advertising top line. Facebook has proven that it can monetize its growing mobile usage in a big way. Investors will be satiated in that concern.
Facebook later noted that mobile revenue will soon outstrip desktop incomes. The company also reaffirmed that Instagram will monetize in the future, largely through advertisements.
Frankly, in my view the 41% figure is quite impressive and unexpectedly strong. However, we should not take as indicative that all desktop Internet giants will be able to monetize at similar levels in mobile settings. Facebook data on its users is nearly without compare, and likely provides it with a key competitive advantage in how it can deliver targeted ads to users on the go.
There are two takeaways from this coverage:
- Facebook managed to significantly expand its mobile ad revenue percentage for the second time (sequential).
- The company said that its mobile incomes would best its desktop revenue.
It seems that investors, at that juncture, bought that Facebook was going to do well in a mobile world (Instagram aside). They were right, of course. The company crested its IPO price following that earnings release. Today it trades for more than $167 per share.
The company is still profitable, still growing and can claim the mantle of mobile-first.
So much for its post-IPO chop. Tying this up neatly, what can we apply from the Facebook lesson to Snap? Nothing. Snap still loses so much money to compare the firms past our superficial alignment would be silly. GAAP profits are an anagram for “the ability to control your own destiny.” On that front, Snap has a long way to go.
Homework: How well did Microsoft do with its Facebook investment at a $15 billion valuation. This will help.