U.S. consumers may be cutting the cord with pay TV, but that doesn’t mean they’ve stopped watching the big screen, according to new data released by Nielsen this morning. In a report detailing the viewing habits of U.S. adults, the measurement firm found that 92 percent of all viewing among U.S. adults (those 18 and older) still takes place on the TV screen.
The data was collected during the fourth quarter of 2016, and compares TV screen-based viewing to viewing on PCs, tablets, smartphones, and other TV-connected devices like game consoles and streaming players such as the Apple TV, Chromecast, Roku and others.
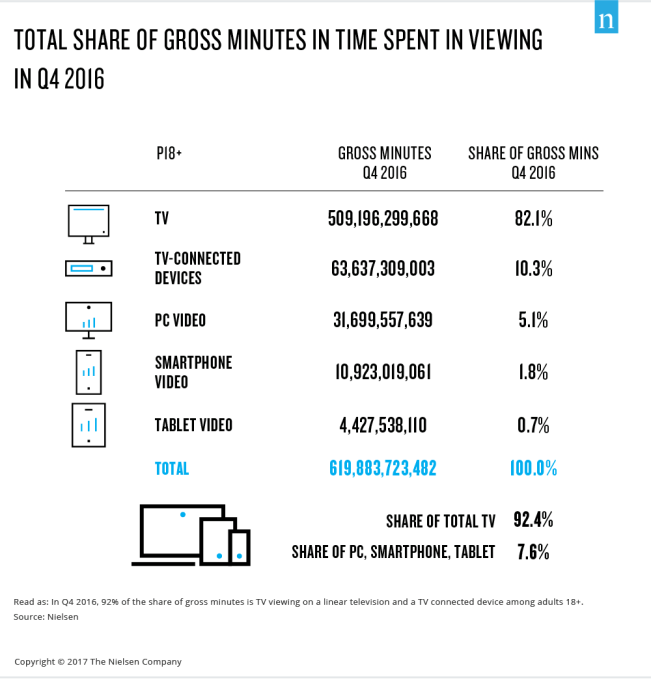
By combining the gross minutes viewed on TV (82.1 percent) with those minutes viewed using TV-connected devices (10.2 percent), Nielsen determined that the lion’s share of video watching continues to be on the big screen. Meanwhile, PCs accounted for 5.1 percent of video-watching minutes during the quarter, smartphones were 1.8 percent, and tablet video was only 0.7 percent.
These findings contradict the current belief that the increasing usage of mobile phones for video viewing has come at the expense of the TV.
“This analysis is based on actual, behavioral data and that is what makes Nielsen an industry leader,” said Peter Katsingris, SVP Audience Insights, Nielsen, about the company’s findings.
“What we found was that contrary to the popular narrative that smaller screens were taking away time from the TV glass, when we looked deeper we found that overall time spent viewing on the TV had the most minutes among every age or ethnic demographic looked at. In some cases the share of viewing was as much as 97 percent,” he added.
That’s not to say that TV-watching means linear television delivered through cable or satellite providers, of course. What sort of content was being watched was not a focus of Nielsen’s study. It’s likely that many of these consumers are not watching live TV, but are instead streaming Netflix or other video content from online services through smart TVs or attached players.
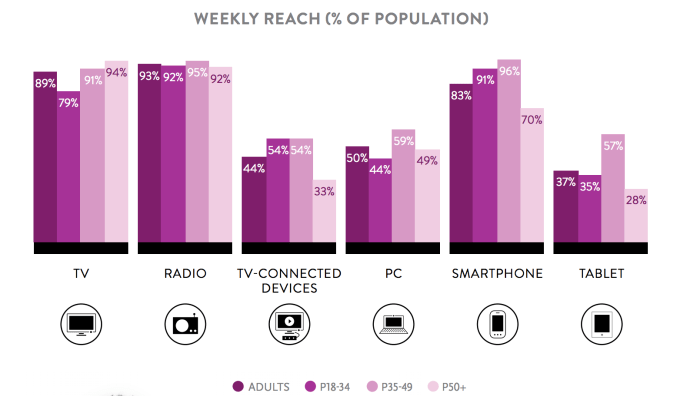
However, while the TV still has a strong toehold for now in terms of total minutes spent viewing, when you delve into the data from other angles, you can see where the smartphone is gaining ground. For example, 91 percent of those 18 to 34 use smartphones each week, but only 79 watch TV. (However, these users do prefer TV-connected devices, as over half use them each week.)
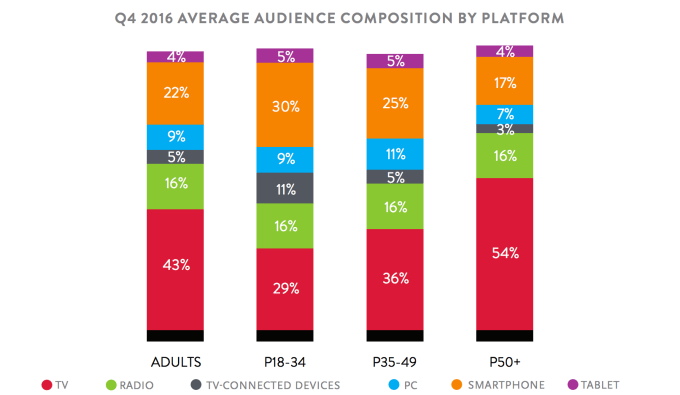
In addition, smartphones account for 30 percent of the total average audience among those 18 to 34, versus 29 percent for TV. Compare that with the older age group (50+), where smartphones only account for 17 percent, and TV 54 percent. (Average audience is defined as the number of adults engaging with the platform in an average minute during the week.)
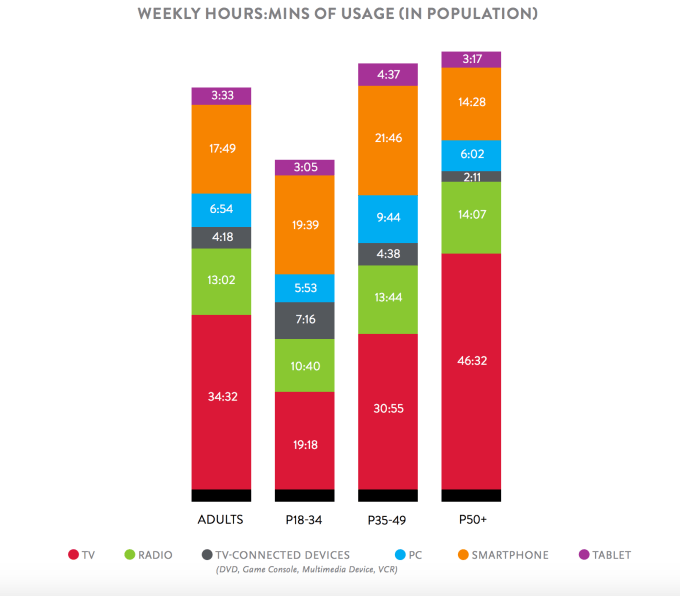
And smartphones are more heavily used among this younger group (18-34) than TV, accounting for 19 hours, 39 minutes of weekly viewing, compared with 19 hours, 18 minutes taking place on TV.
The larger takeaway here is that while the TV may still be the preferred screen for video watching among adults, the smartphone is gaining ground with the youngest demographic. But the overall averages for adults may not fully reflect this shift, due to how much the oldest adults still watch TV.